


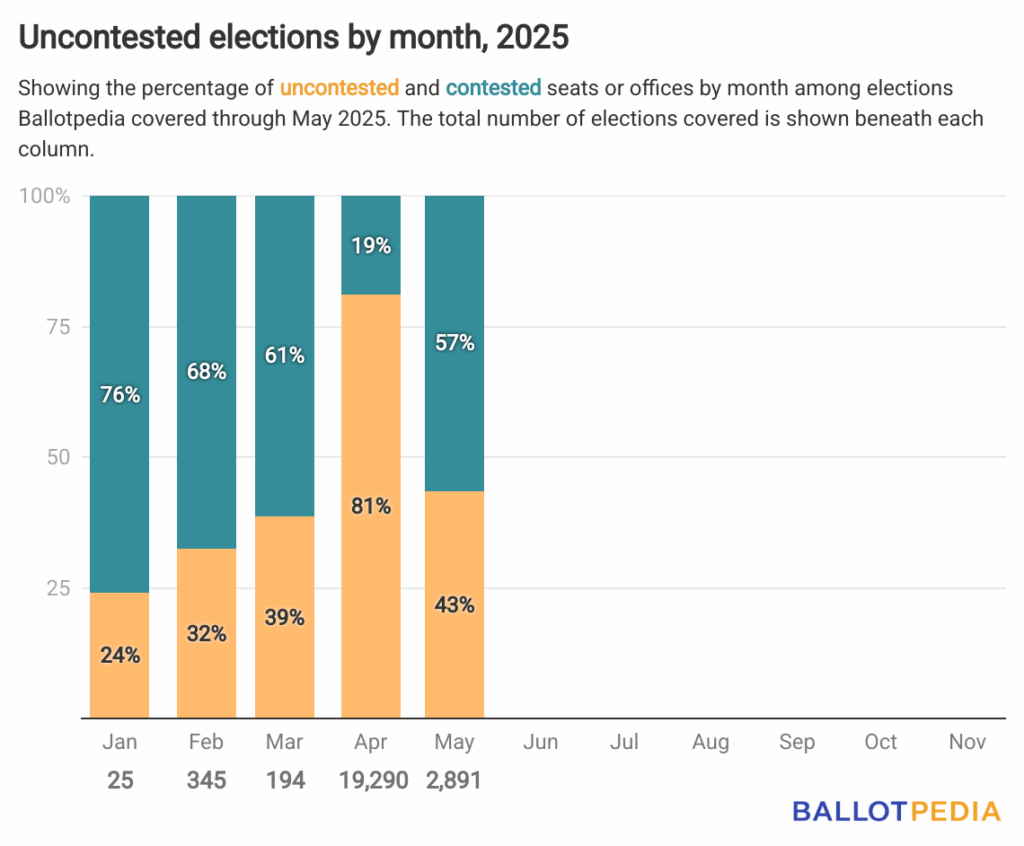
Throughout May, Ballotpedia covered 2,891 elections in 24 states, 43% of which were uncontested.
That’s down from April, when 81% of the 19,290 covered were uncontested.
Ballotpedia defines an uncontested election as one where the number of candidates running is less than or equal to the number of seats up for election. This analysis does not account for write-in candidates.
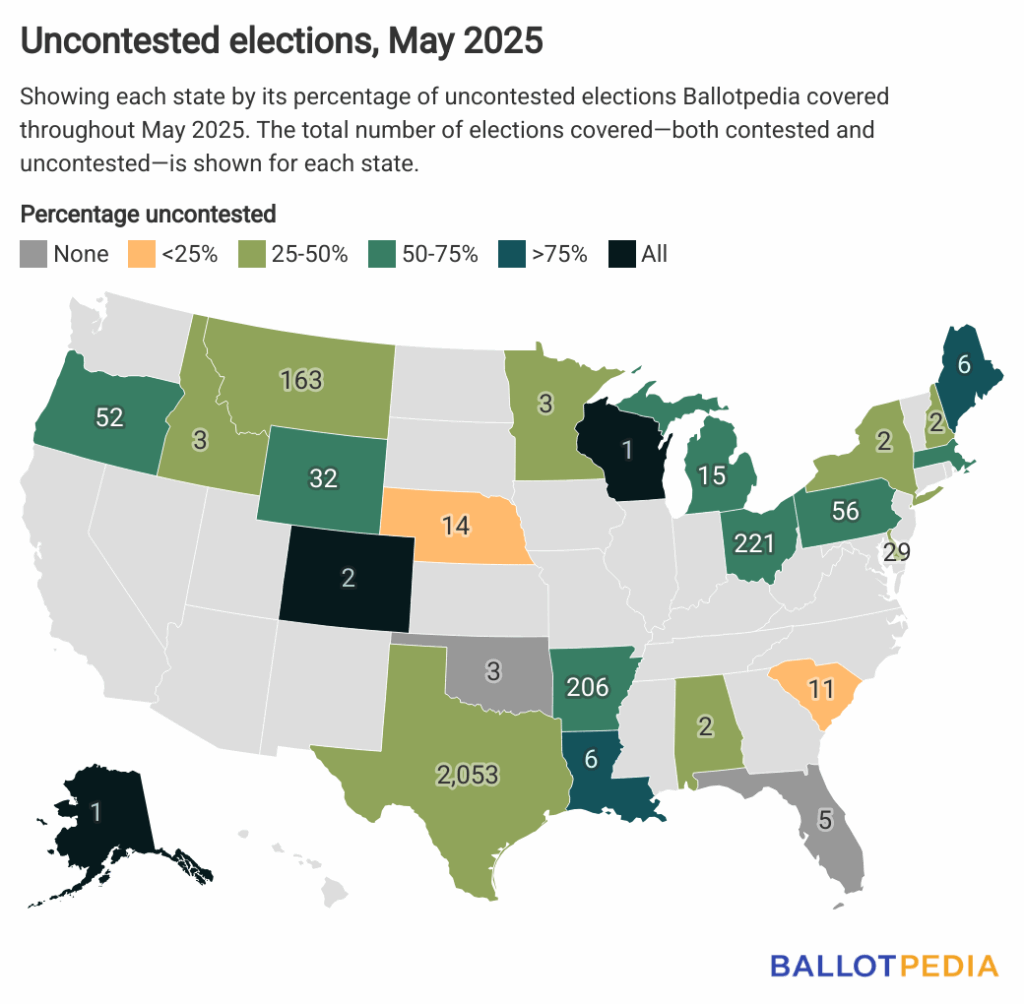
Alaska, Colorado, and Wisconsin had 100% uncontested rates, though each had only one or two races in the sample. Other states with high uncontested rates included Arkansas (73%), Louisiana (83%), Maine (83%), Oregon (63%), and Pennsylvania (70%). In contrast, states such as Florida and Oklahoma had no uncontested races, but both cancel uncontested elections by default. Texas, which had the largest number of total races (2,053), reported 772 uncontested races, yielding an uncontested rate of 38%.
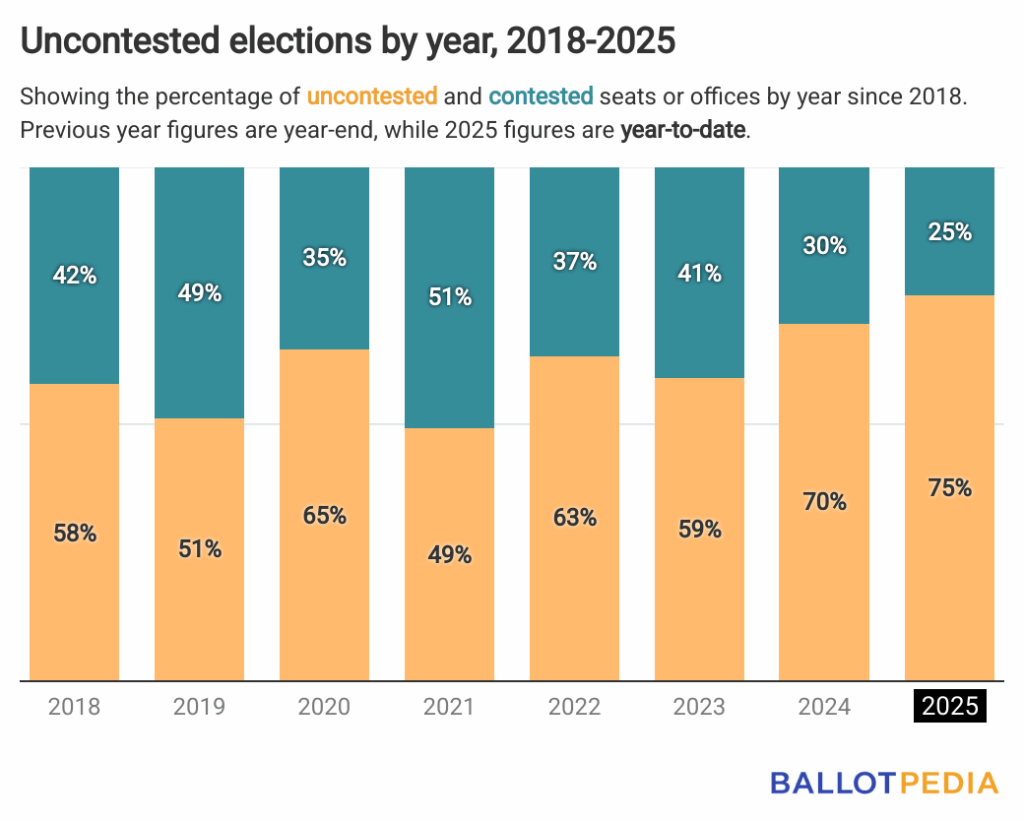
May’s rate of uncontested elections was less than the 64% average rate identified between 2018 and 2024.
It also brings the year-to-date rate of uncontested elections to 75%.
For comparison, since 2018, each year has had more uncontested than contested elections, except for one, in 2021, when 50.4% of the elections Ballotpedia covered were contested.
Click on the link below to learn more about uncontested elections nationwide last month and in all previous months through 2025.