



At the end of October, approval polling averages showed President Donald Trump (R) at 38% approval. Sixty percent of respondents disapproved of his performance. October also saw the lowest average approval rating of Trump's second term, at 37%, on Oct. 22, 2026. The highest average approval rating of Trump's second term was 54%, last seen on Jan. 22, 2025.
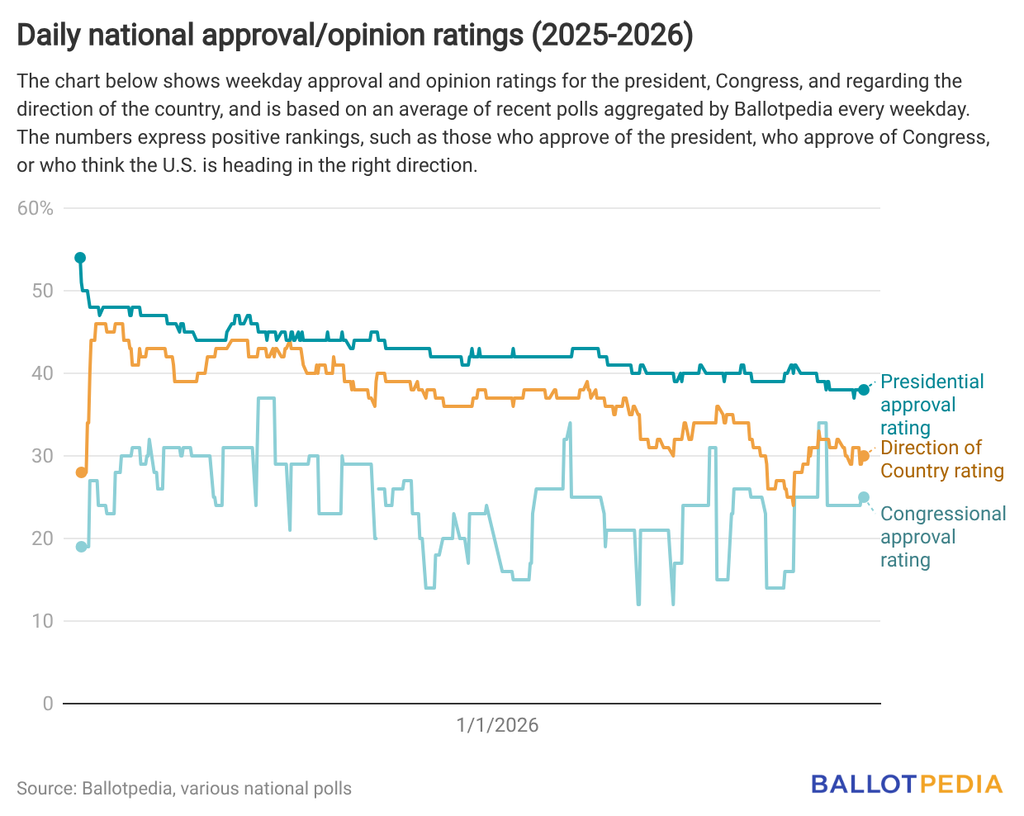
Average congressional approval was 25% at the end of October, and disapproval was 60%. The lowest average approval rating the 119th Congress has received was 12%, last seen on May 26, 2026. The highest average approval rating it has received was 37%, last seen on July 1, 2025.
At the end of October, the average direction of the country rating, which indicates public opinion as to whether the United States is moving in the right or wrong direction, was 30% in the right direction and 65% in the wrong direction. The highest average of respondents saying the country was moving in the right direction during Trump's second term was 46%, last seen on Feb. 26, 2025, with a 48% rating in the wrong direction. The lowest average of respondents saying the country was moving in the right direction during Trump's second term was 24%, last seen on Sept. 2, 2026, with a 66% rating in the wrong direction.
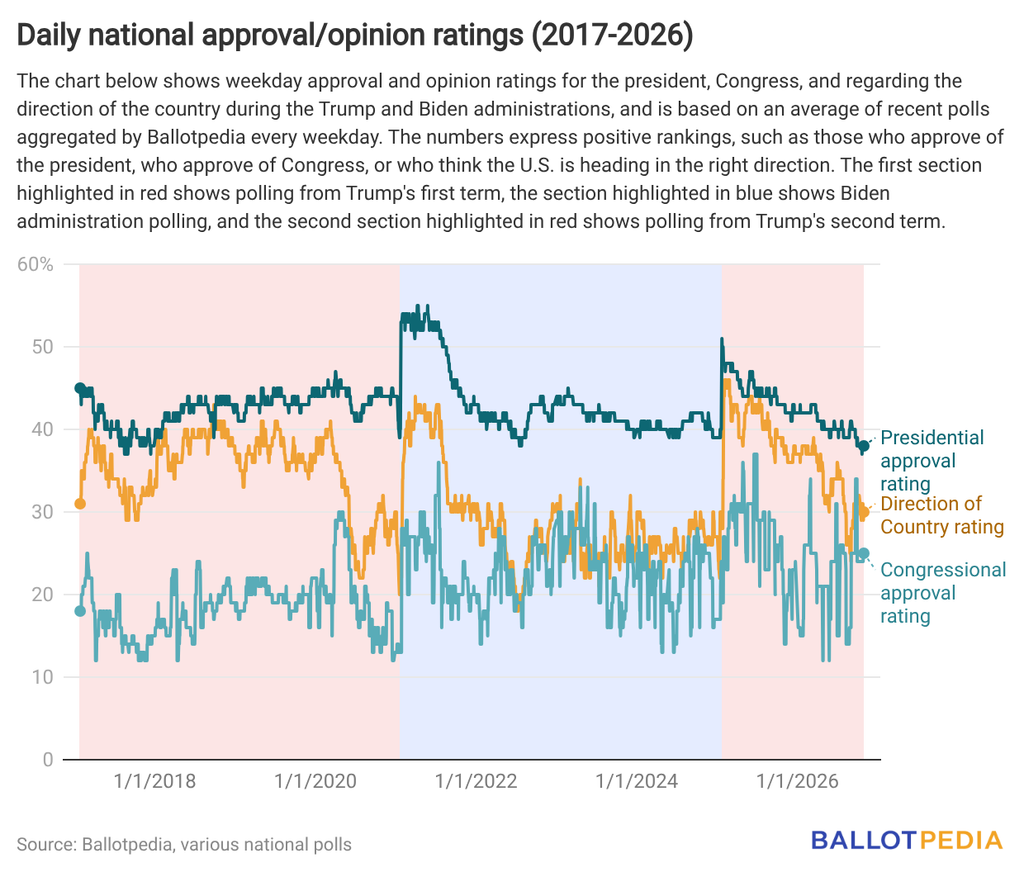
At this point in Trump's first term, average presidential approval was six points higher at 44%, average congressional approval was six points lower at 19%, and the average direction of the country rating for the right direction was 11 points higher at 41%. At this point in the Biden administration, average presidential approval was six points higher at 44%, average congressional approval was the same at 25%, and the average direction of the country rating for the right direction was three points lower at 27%.
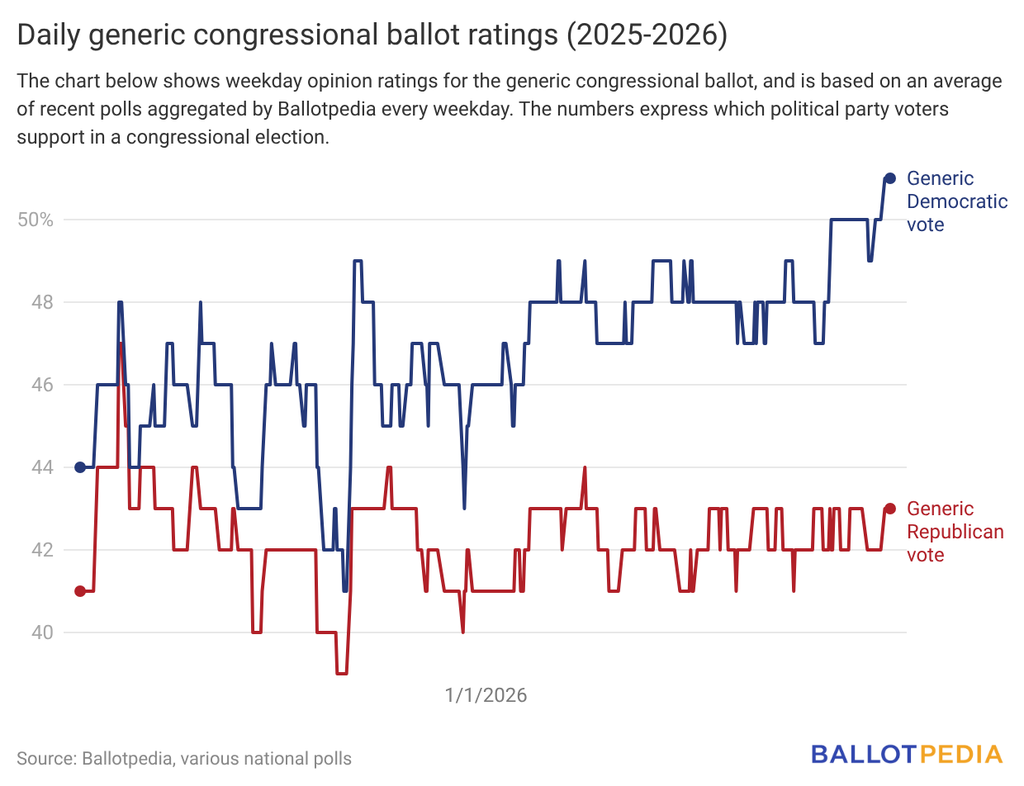
The average generic congressional vote rating for Democrats was 51% at the end of October, the highest average since at least March 2025. The lowest average generic congressional vote rating for Democrats since that date was 41%, last seen on Sept. 19, 2025.
At the end of October, the average generic congressional vote rating for Republicans was 43%. The highest average generic congressional vote rating for Republicans since at least March 2025 was 47%, last seen on April 4, 2025. The lowest average generic congressional vote rating for Republicans since that date was 39%, last seen on Sept. 19, 2025.
Ballotpedia's polling index takes the average of polls conducted over the last 30 days to calculate presidential and congressional approval ratings, direction of the country ratings, and generic congressional vote ratings. We average the results and show all polling results side by side because we believe that shows a clearer picture of public opinion than an individual poll can provide.
Additional reading: