
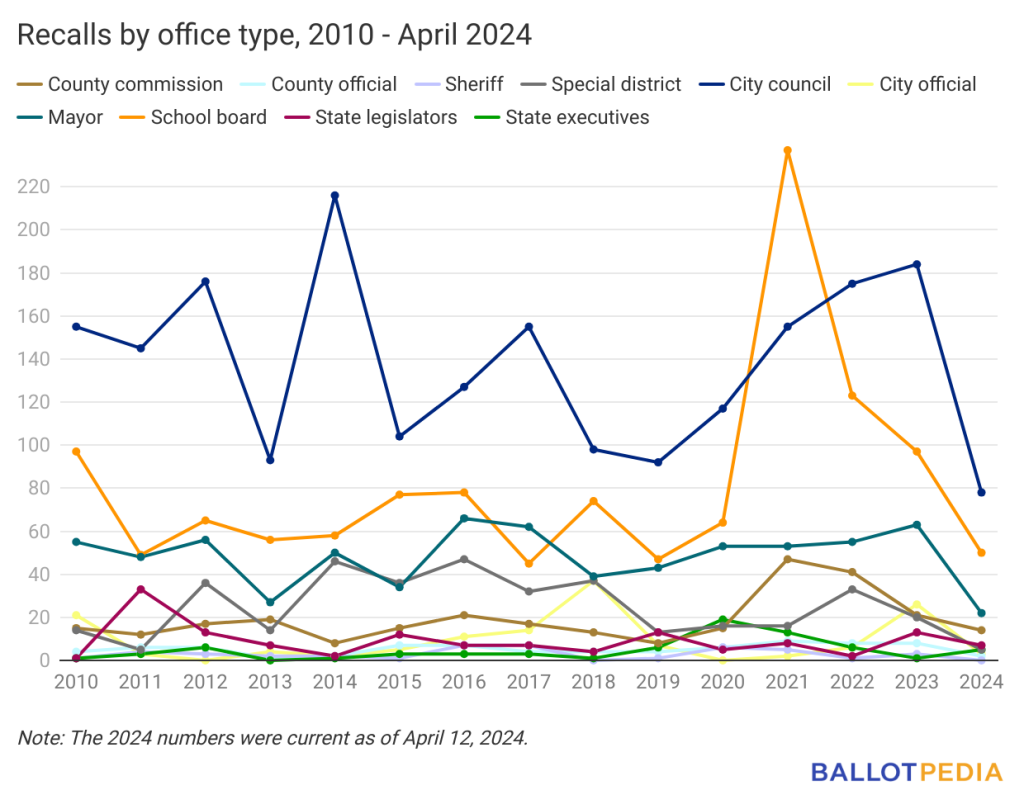
Ballotpedia has tracked recall efforts against 78 city council members this year as of April 12, 2024, which is the most of any office type and accounts for 41.94% of the 186 officials included in recall efforts. City council members also had the highest number of recall efforts started against them from 2010 to 2020 and 2022 to 2023. The exception was 2021 when school board members faced the most recall efforts.
The chart below shows the number of officials included in recall efforts by office type from 2010 through April 12, 2024.
A political recall is the process by which citizens can remove elected officials from office before their term is completed. This process typically includes the circulation of petitions by recall organizers, the evaluation of signatures by election officials, and a public vote if the petitions are deemed to have a sufficient number of valid signatures. The details of the recall process vary from state to state. Click here to learn about the laws governing recalls in each state.
When looking at recalls by state, California had the most officials included in recall efforts with 993 from 2010 to April 12, 2024. Michigan came in second with 964, and Colorado came in third with 344.
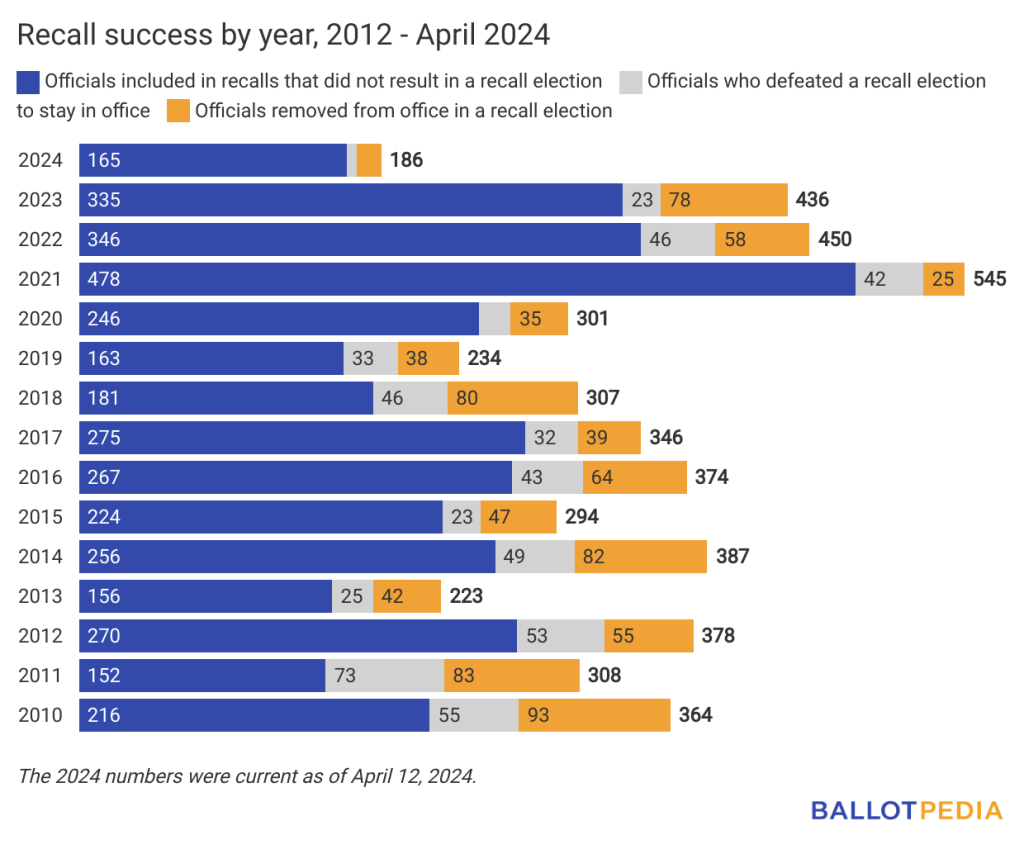
From 2010 to 2023, Ballotpedia covered an average of 217 recall efforts against an average of 353 officials per year. Those recalls saw a 16.56% success rate. The success rate was calculated by dividing the number of recalled officials by the number of officials who were targeted for recall. The highest success rate occurred in 2011 when 83 of the 308 officials targeted for recall were removed from office in a recall election, a success rate of 26.95%. The lowest success rate occurred in 2021 when 25 of the 545 officials targeted for recall were removed from office in a recall election, a success rate of 4.59%.
As of April 12, 2024, Ballotpedia had tracked 117 recall efforts against 186 officials. As of that time, 15 officials targeted for recall had been removed from office in a recall election, a success rate of 8.06%. Another six officials had defeated a recall election to stay in office.
The chart below shows how many officials were included in recall efforts, how many defeated recall elections to stay in office, and how many were removed from office in recall elections from 2010 to mid-April 2024.
Additional reading: