The Daily Brew: So, how close were congressional elections in 2018?


The Daily Brew
Welcome to the Tuesday, June 11, Brew. Here’s what’s in store for you as you start your day:

  1. Five Senate and 44 House races in 2018 were decided by less than 5 percent
  2. Voters to decide at least 19 statewide ballot measures in five states this year
  3. Johnson elected Dallas mayor; Mayor Nirenberg wins re-election in San Antonio

Five Senate and 44 House races in 2018 were decided by less than 5 percent

Last year’s elections were held seven months ago. But we all know it is fun to look back and crunch the numbers every now and then. Today, we explore the margin-of-victory figures.

The average margin of victory in the 2018 elections was the smallest it had been in even-year congressional races since 2012.

Margin of victory—or MOV—is the difference between the share of votes cast for the winning candidate and the share cast for the losing one.

The table below shows the number of congressional elections won by each party in three categories—a margin of less than 5%, a margin between 5% and 15%, and a margin of greater than 15%.

Elections by margin of victory

Since it is June, the sixth month of the year, here are six more quick facts from our research:

  • Sixty-nine percent of 2018’s congressional races were decided by a margin of more than 15 percentage points.

  • In 2018’s 33 regularly-scheduled U.S. Senate elections, the average MOV was 16.8%. This was the smallest average since 2012 when that year’s Senate races averaged a 20% MOV.

  • Republican candidates who won Senate races had an average MOV of 14.3%, compared to an MOV of 16.8% in races won by Democratic candidates. Seventeen Senate races (more than half) were decided by a margin of victory greater than 15%.

  • The closest Senate race was in Florida, where then-Gov. Rick Scott (R) defeated incumbent Bill Nelson (D) by a margin of 0.12%—10,003 votes out of 8.2 million cast. The largest MOV was in Hawaii, where incumbent Mazie Hirono (D) won by 42.3%.

  • In 434 U.S. House elections, the average margin of victory was 30.2%. This was the smallest average since 2012 when the average MOV was 31.8%. Republican candidates who won did so by an average margin of 22.8%. The average margin in House races won by Democrats was 36.6%.

  • The closest House race was in Georgia’s 7th Congressional District where incumbent Rob Woodall (R) defeated Carolyn Bourdeaux (D) by 433 votes—a margin of 0.15%.

Learn more

Forward This blank   Tweet This blankblank   Send to Facebook


blank

Ballotpedia Events


Voters to decide at least 19 statewide ballot measures in five states this year

In the last few months, I’ve brought you stories about individual ballot initiatives that will be decided by voters in 2019. As we near the halfway point in the year, let’s take the temperature of where things stand so far.

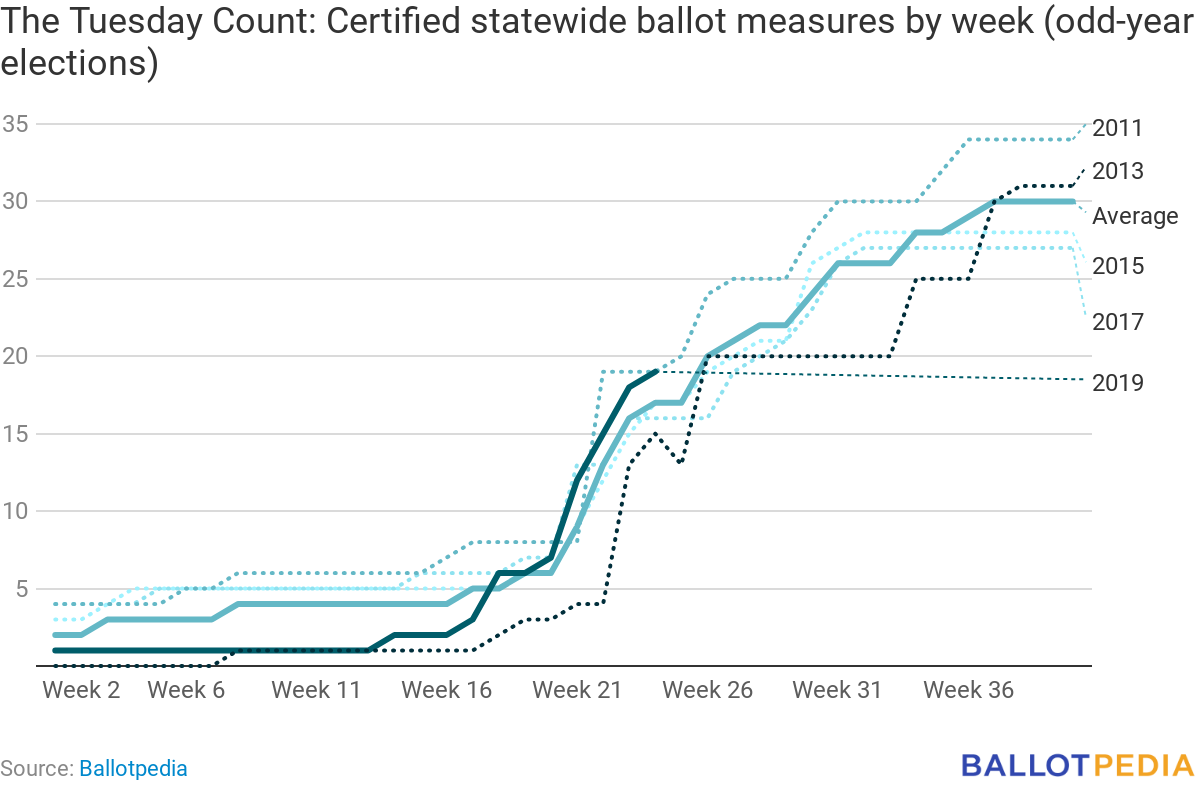
19 statewide ballot measures have certified for the 2019 ballot in five states—Colorado (two), Kansas (one), Louisiana (four), Texas (10), and Washington (two). In Louisiana, the measures will appear on the October 12 primary election ballot. The other measures certified so far will be decided by voters on November 5.

Of the 19 measures, 18 were referred to the ballot by state legislatures and one was placed on the ballot via citizen initiative. That initiative, in Washington, seeks to limit annual license fees and taxes on motor vehicles.

Some of the topics which voters will address in these measures include transportation, taxes and tax exemptions, revenue allocation and budgets, the census, education, animal care, bonds, and the administration of government.

In the past four odd-numbered years, the average number of certified statewide measures by this date was between 16 and 17, and the average total number of statewide measures was 30. In 2017, 27 statewide measures were certified.

The Tuesday CountFour states—Colorado, Maine, Ohio, and Washington—allow for citizen-initiated ballot initiatives or veto referendums in elections in odd-numbered years. The next upcoming signature submission deadlines for citizen initiatives in those states are on July 3 (Ohio) and July 5 (Washington). Legislatively referred measures can also be approved in those four states in 2019. Other states that frequently feature statewide measures in odd-numbered years include Louisiana, New Jersey, New York, and Texas.

Johnson elected Dallas mayor; Mayor Nirenberg wins re-election in San Antonio

While much of the country was partaking in their usual weekend activities, voters in San Antonio and Dallas were electing new mayors. In case you missed it, here’s a quick rundown of who won the Saturday runoff elections.

Dallas

State Rep. Eric Johnson defeated City Councilmember Scott Griggs in the runoff election for mayor of Dallas. Johnson received 56 percent of the vote to Griggs’ 44 percent.

Johnson was first elected to the Texas House of Representatives in 2010. Although municipal elections in Dallas are officially nonpartisan, Johnson and outgoing Mayor Mike Rawlings are Democrats.

Saturday’s elections also featured runoffs for four seats on the Dallas City Council, whose members are up for election every two years. Of the ten council incumbents who sought re-election in 2019, two were defeated.

San Antonio

Incumbent Ron Nirenberg defeated council member Greg Brockhouse to win a second two-year term as mayor of San Antonio. Nirenberg received 51.1% of the vote and Brockhouse received 48.9%. Nirenberg has said he is not affiliated with any political party.

The total number of votes cast in Saturday’s runoff was 120,723, a 19% increase over the 101,277 votes cast in the May 4 general election. There have been five mayoral runoff elections in San Antonio since 1997, and in all but one, the total votes cast in the runoff exceeded the number cast in the general election.

In San Antonio’s city council elections this year, which concluded with three runoffs on Saturday, all seven incumbents who ran for re-election won another term.