Over 4,700 candidates responded to Ballotpedia’s Candidate Connection survey in 2020
For the third year in a row, Ballotpedia invited all candidates in our coverage scope to complete our Candidate Connection survey. In 2020, we covered 29,002 federal, state, and local candidates. Our survey asks candidates about their backgrounds, priorities, and proposed solutions to the issues faced by their communities, and aims to enable voters to learn more about political candidates as people.
We received submissions from 4,745 candidates—or 16.4% of all 2020 candidates we tracked.
Here are five highlights:
- The 16.4% completion rate is more than double the response rate in 2018. That year, we had 1,957 survey respondents out of 28,315 total candidates covered by Ballotpedia that year, for a completion rate of 6.9%.
- Incumbents accounted for 5.5% of respondents, with challengers making up the remaining 94.5%.
- Of the 4,745 candidates who completed Ballotpedia's candidate survey, 743—15.7%—won their elections. In 2018, 477 of the 1,957 candidates who responded to our survey, or 24.4%, won their races.
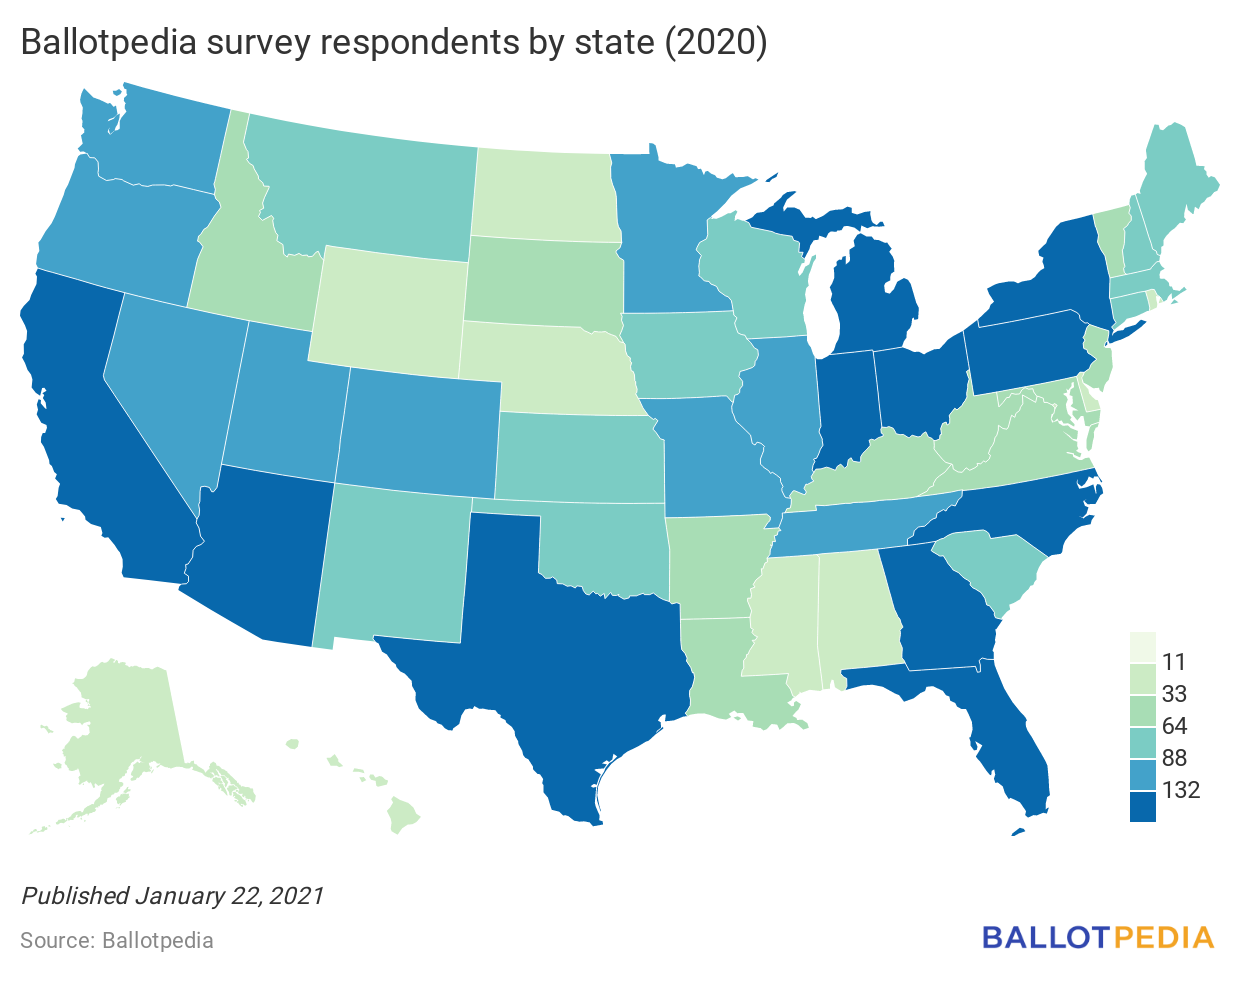
- Candidates from all 50 states and the District of Columbia responded to Ballotpedia's Candidate Connection in 2020. Texas had the most respondents with 391, followed by California at 375 respondents and Michigan at 225.
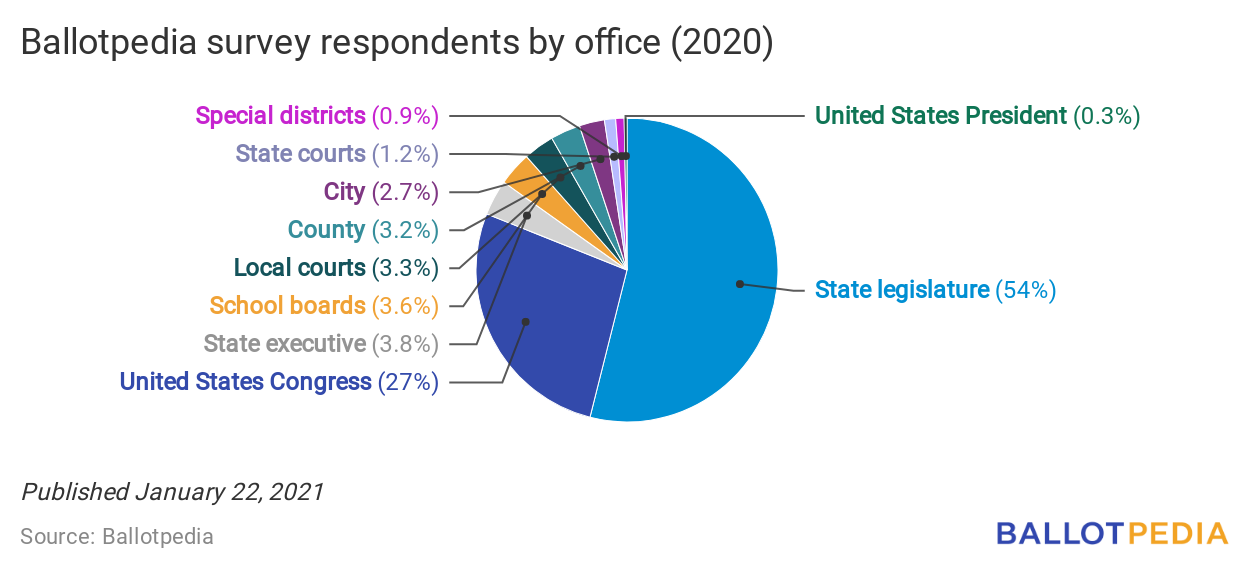
- Over half of our survey respondents (54.0%) ran for a state legislative office. Those running for Congress were the second-largest group (27.1%), followed by candidates running for state executive seats (3.8%).
Curious what these candidates had to say? Explore a sample of their answers through our Candidate Questions tool!
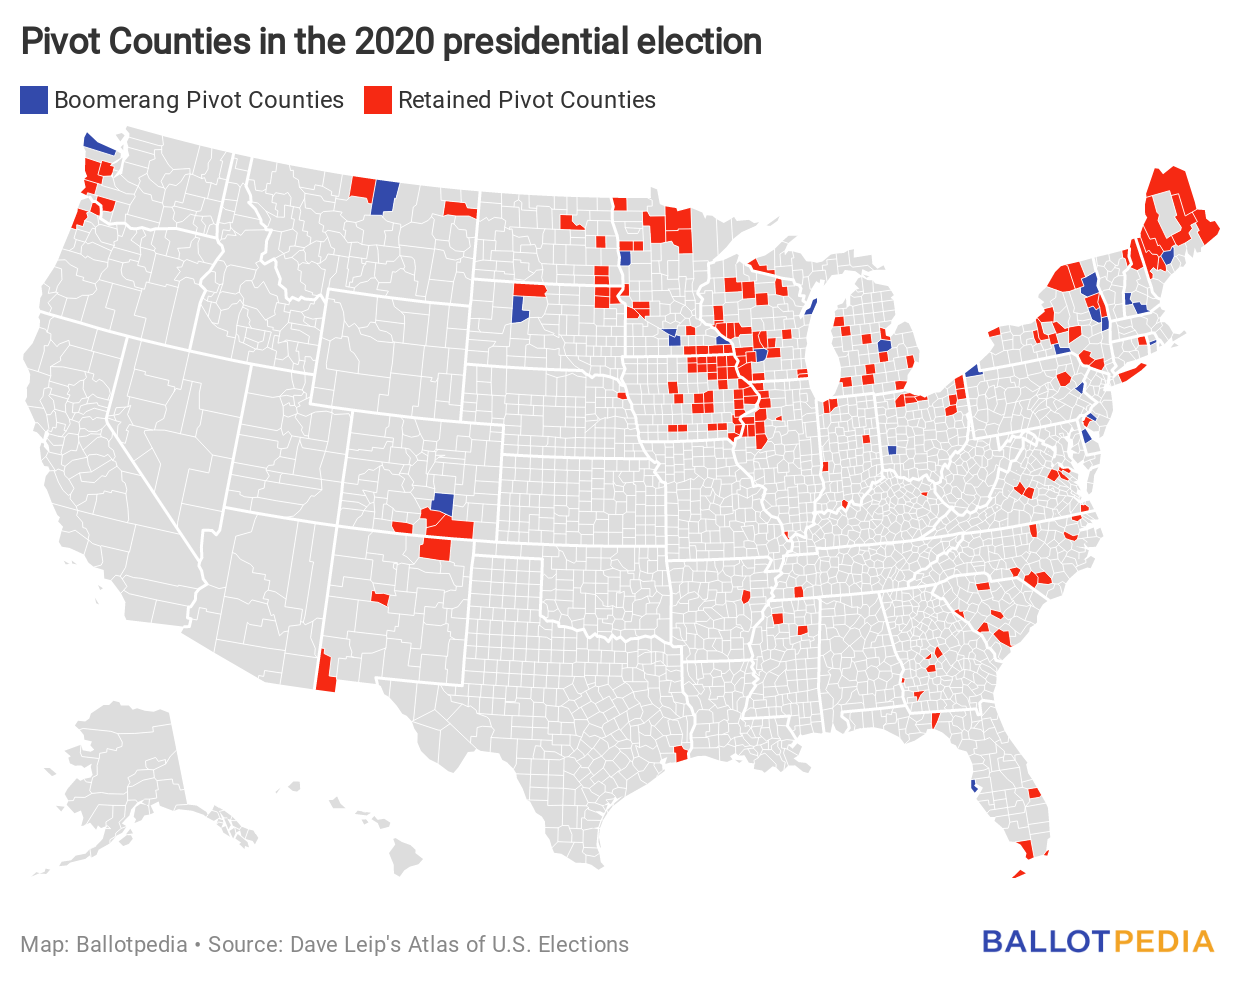
Analyzing the demographics of 2020’s Pivot Counties
ICYMI, we held a briefing last week providing some in-depth analysis of last year’s voter turnout in Pivot Counties.
Ballotpedia identified 206 counties nationwide that voted for Barack Obama (D) in the 2008 and 2012 presidential elections and Donald Trump (R) in 2016. After the 2020 election, we labeled the 181 counties that voted for Trump in 2020 as Retained Pivot Counties and the 25 counties that voted for Joe Biden (D) as Boomerang Pivot Counties.
Here are three interesting facts I learned watching the briefing:
- Retained Pivot Counties are less populous on average than Boomerang Pivot Counties. The average population of a Retained Pivot County is 62,980 compared to 186,852 of a Boomerang Pivot County. The nationwide county population average is 104,435. From 2016 to 2020, the population of Retained Pivot Counties decreased 0.1%, and Boomerang Pivot Counties increased 1.0%.
- The average median home value is higher in Boomerang Pivot Counties than in Retained Pivot Counties. The national median home value is $204,900. Thirty-two percent (32%) of Boomerang Pivot Counties have a median value more than the average, compared to 4% of Retained Pivot Counties.
- Both Retained (79.6%) and Boomerang Pivot Counties (78.2%) have a higher-than-average non-Hispanic white population compared to the national average of 60.1%. In total, 82% of Retained Pivot Counties (149) and 88% of Boomerang Pivot Counties (22) exceed that national rate.
We discussed even more interesting facts about Pivot Counties, including an analysis of counties that have flipped parties every two cycles going back to the 1970s! Click here to watch the full recording of last week’s briefing.
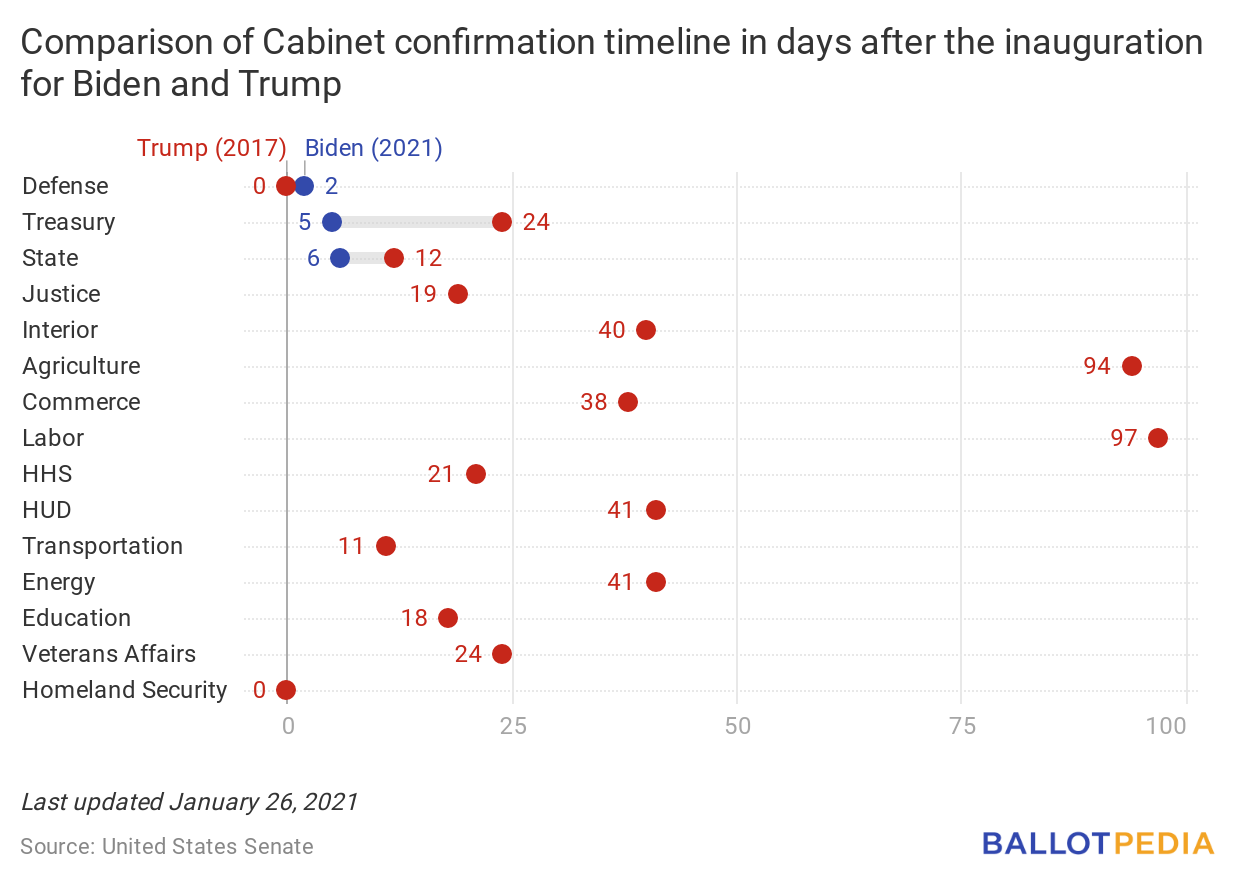
U.S. Senate has confirmed three Biden Cabinet secretaries so far
One of the leading priorities of a new presidential administration involves selecting and swearing in members of the Cabinet. The president's Cabinet includes the heads of 15 key executive agencies like the Department of Commerce and Department of Defense.
Presidents may also give Cabinet-rank status to other specific positions, such as the director of the Central Intelligence Agency or the chairman of the Council of Economic Advisers. The vice president is also part of the Cabinet. All Cabinet positions—except for the vice president and White House chief of staff—require confirmation by the U.S. Senate.
Seven days after their respective inaugurations, Trump had two main Cabinet members confirmed, and Biden had three.
Obama outpaced both of his successors with 10 confirmations at this point following his inauguration. An eleventh Obama Cabinet member—Secretary of Defense Robert Gates—was held over from the Bush administration.
The following chart compares the pace of Senate confirmations for the main 15 Cabinet members following the inaugurations of Presidents Donald Trump (R) in 2017 and Joe Biden (D) in 2021. We also have a similar chart comparing the pace of Senate confirmations between the Obama and Biden administrations here. These charts do not include other Cabinet-rank positions whose inclusion in the Cabinet varies from administration to administration.