


Welcome to the Wednesday, September 14, Brew.
By: David Luchs
Here’s what’s in store for you as you start your day:
- Part 1 - Analysis of major party candidates on the primary ballot
- 137 measures have been certified for statewide ballots this year
- New Mexico’s lone Republican member of Congress faces a toss-up general election
Part 1 - Analysis of major party candidates on the primary ballot
Now that primary season is complete let's look back at the data. Over the next two days we'll tell you all about major party candidates and how many ran for office in this year's primaries. Today, we look at congressional candidates. Keep an eye out for our analysis of state candidates in tomorrow's edition.
More Republicans are running for Congress this year than in either 2020 or 2018, and Republicans make up a larger percentage of major party congressional candidates than in either year.
In the House, each election year since 2018 has had fewer Democrats and more Republicans run. In the Senate, both parties have more candidates running this year than in either 2020 or 2018, although more Republicans are running than Democrats.
This year, 2,422 major party candidates appeared on the primary ballot for 474 seats in Congress. That included 34 U.S. Senate seats, all 435 U.S. House seats, and the seats of five of the six non-voting delegates to the U.S. House.
Of the 2,422 candidates who appeared on primary ballots, 989, or 40.8%, were Democrats, and 1,433, or 59.2%, were Republicans.
U.S. Senate
There were 304 major party candidates on the primary ballot this year, including 119 Democrats, or 39.1% of all candidates who ran, and 185 Republicans, or 60.9% of all candidates who ran.
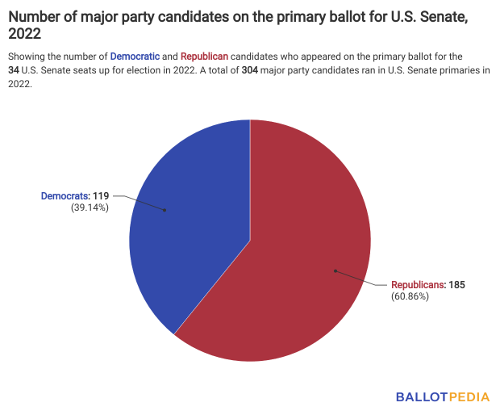
The 119 Democrats who appeared on the primary ballot this year were 11 more than the 108 who appeared on the ballot in 2020 and 33 more than the 86 who appeared in 2018.
The 185 Republicans who appeared on the ballot were 62 more than the 123 who appeared on the ballot in 2020 and 44 more than the 141 who appeared in 2018.
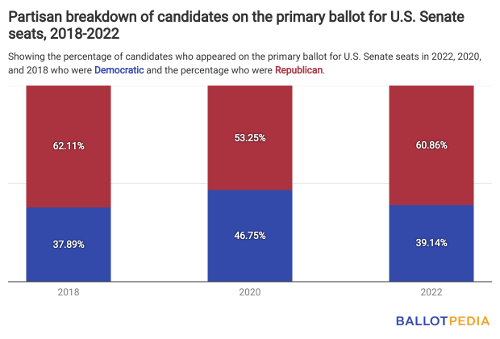
The percentage of major party candidates this year who ran as Democrats was lower than in 2020, when 46.8% of major party candidates did, but higher than in 2018 when 37.9% did.
Conversely, the percentage of major party candidates who ran as Republicans this year was higher than in 2020, when 53.3% did, but lower than in 2018 when 62.1% did.
There were 3.5 Democratic candidates on the ballot per U.S. Senate seat this year. That’s more than the 3.27 Democrats per seat who appeared on the ballot in 2020 and the 2.61 Democrats per seat who appeared in 2018.
There were 5.44 Republican candidates on the ballot per U.S. Senate seat in 2022. That's more than the 3.73 Republicans per seat who appeared on the ballot in 2020 and the 4.27 Republicans per seat who appeared in 2018.

U.S. House
There were 2,118 major party candidates on the primary ballot this year, including 870 Democrats, or 41.1% of all candidates who ran, and 1,248 Republicans, or 58.9% of all candidates who ran.

The 870 Democrats who appeared on the primary ballot this year were 75 fewer than the 945 who appeared on the ballot in 2020 and 211 fewer than the 1,081 who appeared in 2018.
The 1,248 Republicans who appeared on the ballot were 195 more than the 1,053 who appeared on the ballot in 2020 and 382 more than the 866 who appeared in 2018.
The percentage of major party candidates this year who ran as Democrats was lower than in 2020 when 47.3% of major party candidates did, and in 2018 when 55.5% did.
Conversely, the percentage of major party candidates who identified as Republicans this year was higher than in 2020 when 52.7% did, and in 2018 when 44.5% did.

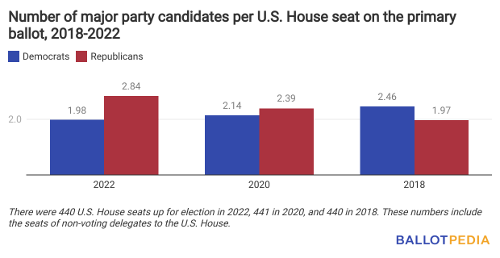
There were 1.98 Democratic candidates on the ballot per U.S. House seat this year. That’s fewer than the 2.14 Democrats per seat who appeared on the ballot in 2020 and the 2.46 Democrats per seat who appeared in 2018.
There were 2.84 Republican candidates on the ballot per U.S. House seat in 2022. That's more than the 2.39 Republicans per seat who appeared on the ballot in 2020 and the 1.06 Republicans per seat who appeared in 2018.
137 measures have been certified for statewide ballots this year
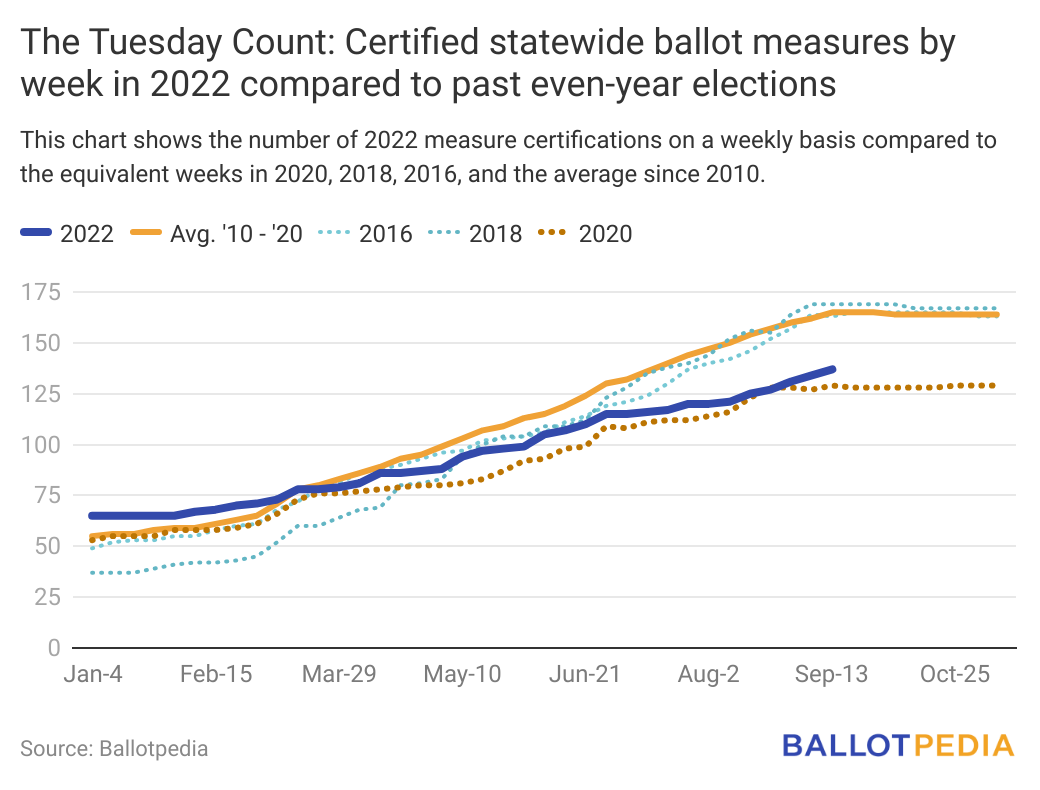
We’re close to having our final count of certified ballot measures for the Nov. 8 ballot. As of Sept. 14, election officials have certified 137 statewide measures for the ballot in 37 states, 28 fewer measures than the average number certified at this point in other even-numbered years from 2010 to 2020.
Here’s an update on the latest ballot measure activity:
Four new measures were certified for the ballot last week:
- Massachusetts Question 4, Remove Proof of Citizenship or Immigration Status for Driver's License Applications Referendum
- Michigan Proposal 3, Right to Reproductive Freedom Initiative
- Michigan Proposal 2, Right to Voting Policies Initiative
- North Dakota Term Limits for Governor and State Legislators Initiative
Proponents withdrew one certified measure from the ballot last week:
From 2010 to 2020, an average of 164 measures were certified in even-numbered years for a statewide vote. By this time during even-numbered years from 2010 through 2020, an average of 165 statewide measures had been certified for the ballot. This figure is lower than the average final total of 164 because courts can remove measures from the ballot before the election.
New Mexico’s lone Republican member of Congress faces a toss-up general election
Today is the 12th day of our 50 States in 50 days series, and we’re featuring New Mexico, the Land of Enchantment.
Week One: Pennsylvania, Indiana, South Dakota, Nebraska, North Dakota
Week Two: California, Georgia, Texas, Montana
Week Three: North Carolina, Virginia
On the ballot in New Mexico
New Mexico voters will elect three members to the U.S. House of Representatives.
Twelve state executive offices are on the ballot this year: governor, lieutenant governor, attorney general, secretary of state, treasurer, auditor, public lands commissioner, and five seats on the public education commission.
All 70 seats in the New Mexico House of Representatives are up for election. Elections for seats in the New Mexico Senate will next occur in 2024.
Two seats on the New Mexico Supreme Court are up for contested election, while a third justice is up for retention. Three seats on the New Mexico Court of Appeals are also up for election this year. Two of those will be contested elections and the third will be a retention election.
Ballotpedia is also covering 24 municipal elections in Bernalillo County: two seats on the county commission, county assessor, county sheriff, probate judge, and 19 seats on the metropolitan court.
Redistricting highlights
New Mexico’s U.S. House delegation remained at three members following the 2020 census.
Congressional and state legislative elections will take place under new district lines following the census. Our side-by-side map comparison tool allows you to immediately see what redistricting looks like in your state. Visit our New Mexico redistricting page to use the map comparison tool and explore the changes to New Mexico’s congressional and state legislative district maps.
Partisan balance
- Both of New Mexico’s U.S. Senators—Martin Heinrich and Ben Ray Luján—are Democrats.
- New Mexico’s U.S. House delegation consists of two Democrats and one Republican.
- Democrats hold a 26-15 (with one independent) majority in the state Senate and a 44-24 (with one independent and one vacancy) majority in the state House. Because the governor is a Democrat, New Mexico is one of 14 Democratic trifectas. It has held this status since 2019.
- New Mexico has had a Democratic governor since 2019.
- Along with the governor, the secretary of state and attorney general are also Democrats, making the state one of 18 with a Democratic triplex among those offices.
Seats contested by only one major party
In 2022, 36 state legislative seats in New Mexico, or 51% of all seats up for election, do not have major party competition. When a candidate from only one of either the Democratic or Republican parties runs in a state legislative district, that candidate is all but guaranteed to win the district.
Democrats are running in 76% of all state legislative races. Seventeen state legislative races (24% of the total) do not have a Democratic candidate, meaning a Republican is likely to win.
Republicans are running in 73% of all state legislative races. Nineteen races (27% of the total) do not have a Republican candidate, meaning a Democrat is likely to win.
Key races
- U.S. House, New Mexico District 2: Yvette Herrell, the state’s lone Republican member of Congress, won District 2 54%-46% in 2020. She faces Gabriel Vasquez (D) and Eliseo Luna (D) (Write-in) in the general election. Three independent election forecasters rate the election a Toss-up.
- Governor of New Mexico: Michelle Lujan Grisham (D), first elected in 2018, is running for re-election. She faces Mark Ronchetti (R) and Karen Bedonie (L) in the general election. Three independent forecasters rate the election Lean Democratic. Lujan Grisham won her first term 57%-43%.
Ballot measures
There are six measures on the ballot this year, including:
- New Mexico Appointed Judge Elections Amendment: Would require newly appointed judges to stand for retention at the next general election at least one year after their appointment. Currently, judges must stand for retention at the general election following their appointment.
- Early Childhood Education Amendment: Would require a percentage of the Land Grant Permanent Fund be used to fund early childhood education and the public school permanent fund.
Between 1985 and 2020, 102 ballot measures appeared on statewide ballots. Eighty-nine (57.7%) ballot measures were approved, and 13 (12.8%) ballot measures were defeated.
Voting
- Polls are open from 7 a.m. to 7 p.m. local time.
- New Mexico generally does not require identification to vote. To read about the specific case where voter identification may be required, click here.
- Early voting sites open on Oct. 11 and close on Nov. 5.
- The voter registration deadline is Oct. 11. Registration can be done in person, by mail, or online, with mailed forms received by the deadline.
Want to learn more about the elections you’ll be voting in this year? Click here to use our Sample Ballot Lookup tool!