Here is our weekly round-up on election-related legislation. In it, you'll find the following information on the big picture:
- Legislative status: How many bills have been introduced, voted upon, or enacted into law?
- Concentration of activity: What states have seen the highest concentration of legislative activity?
- Partisan affiliation of sponsorship: How many bills have been sponsored by Democrats vs. Republicans?
- Subject: What subjects are most commonly addressed in the bills?
The big picture
To date, we have tracked 2,519 election-related bills. This represents a marginal decrease as compared to last week's total. These bills were either introduced this year or crossed over from last year's legislative sessions.
Legislative status
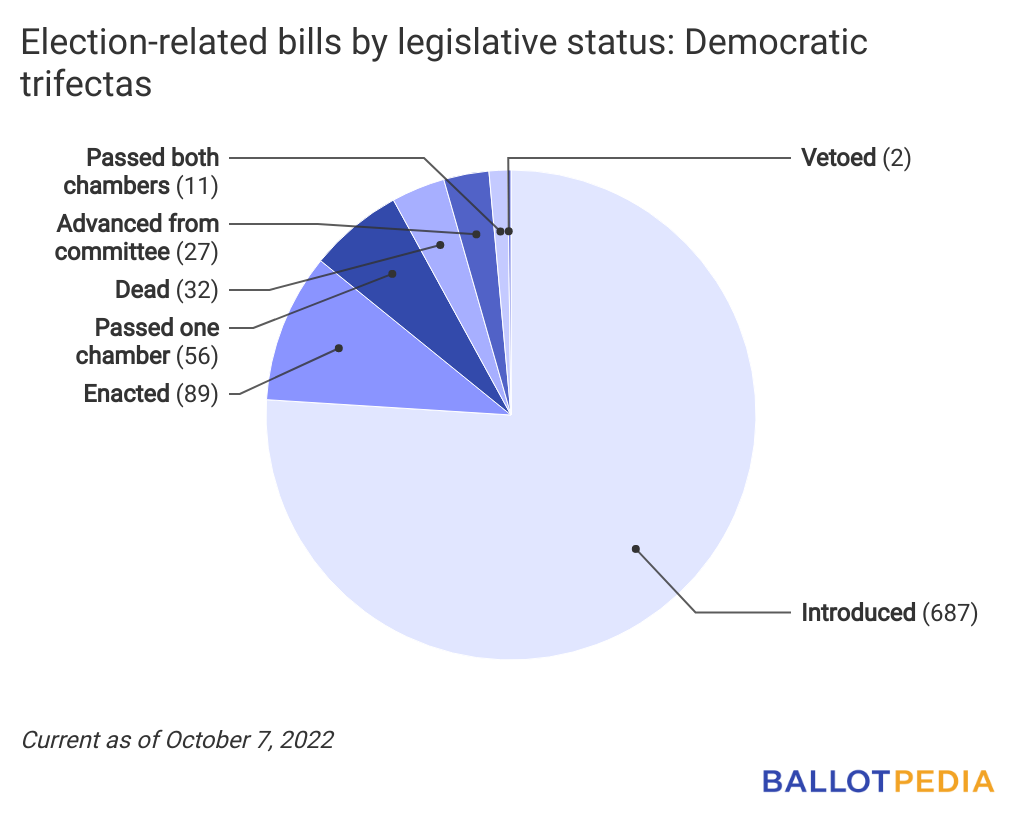
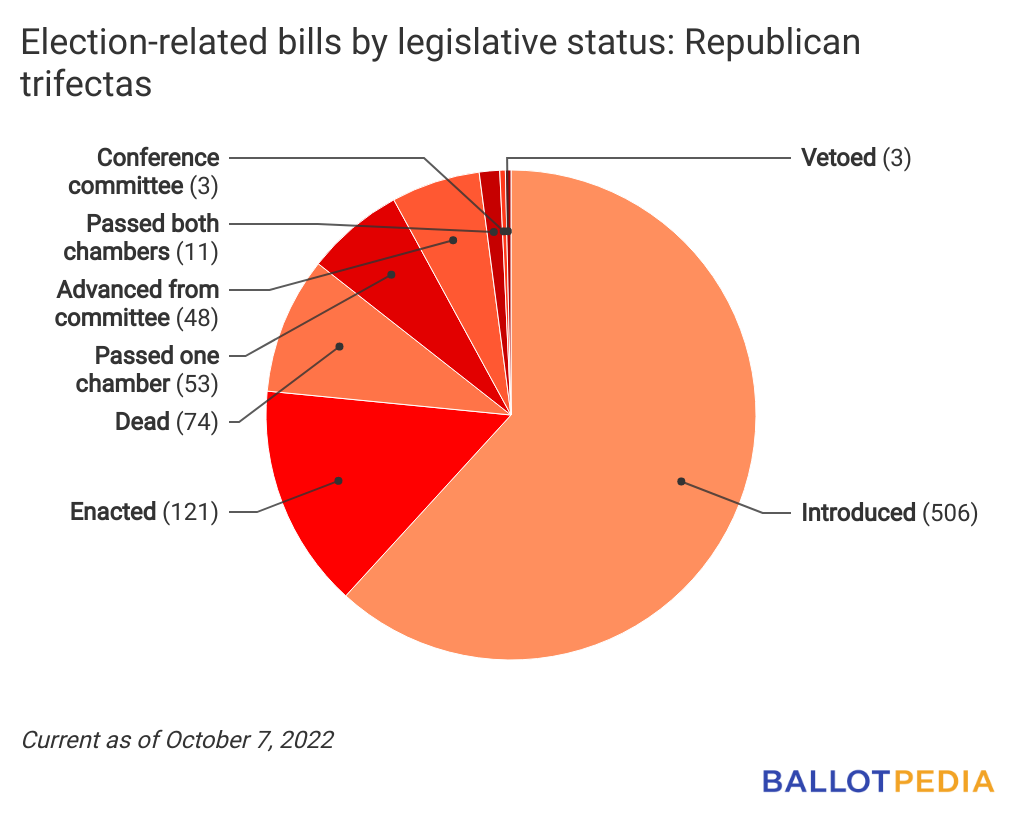
The pie charts below visualize the legislative status of the bills we are tracking. The following status indicators are used:
- Introduced: The bill has been pre-filed, introduced, or referred to committee but has not otherwise been acted upon.
- Advanced from committee: The bill has received a favorable vote in committee. It has either advanced to another committee or to the floor for a vote.
- Passed one chamber: The bill has been approved by one legislative chamber.
- Conference committee: Differing versions of the bill have been approved by their respective chambers and a conference committee has been appointed to reconcile the differences.
- Passed both chambers: The bill has cleared both chambers of the legislature.
- Enacted: The bill has been enacted into law, by gubernatorial action or inaction or veto override.
- Vetoed: The bill has been vetoed.
- Dead: The bill has been defeated in committee or by floor vote.
The pie charts below visualize the legislative status of bills in Democratic and Republican trifectas, respectively.
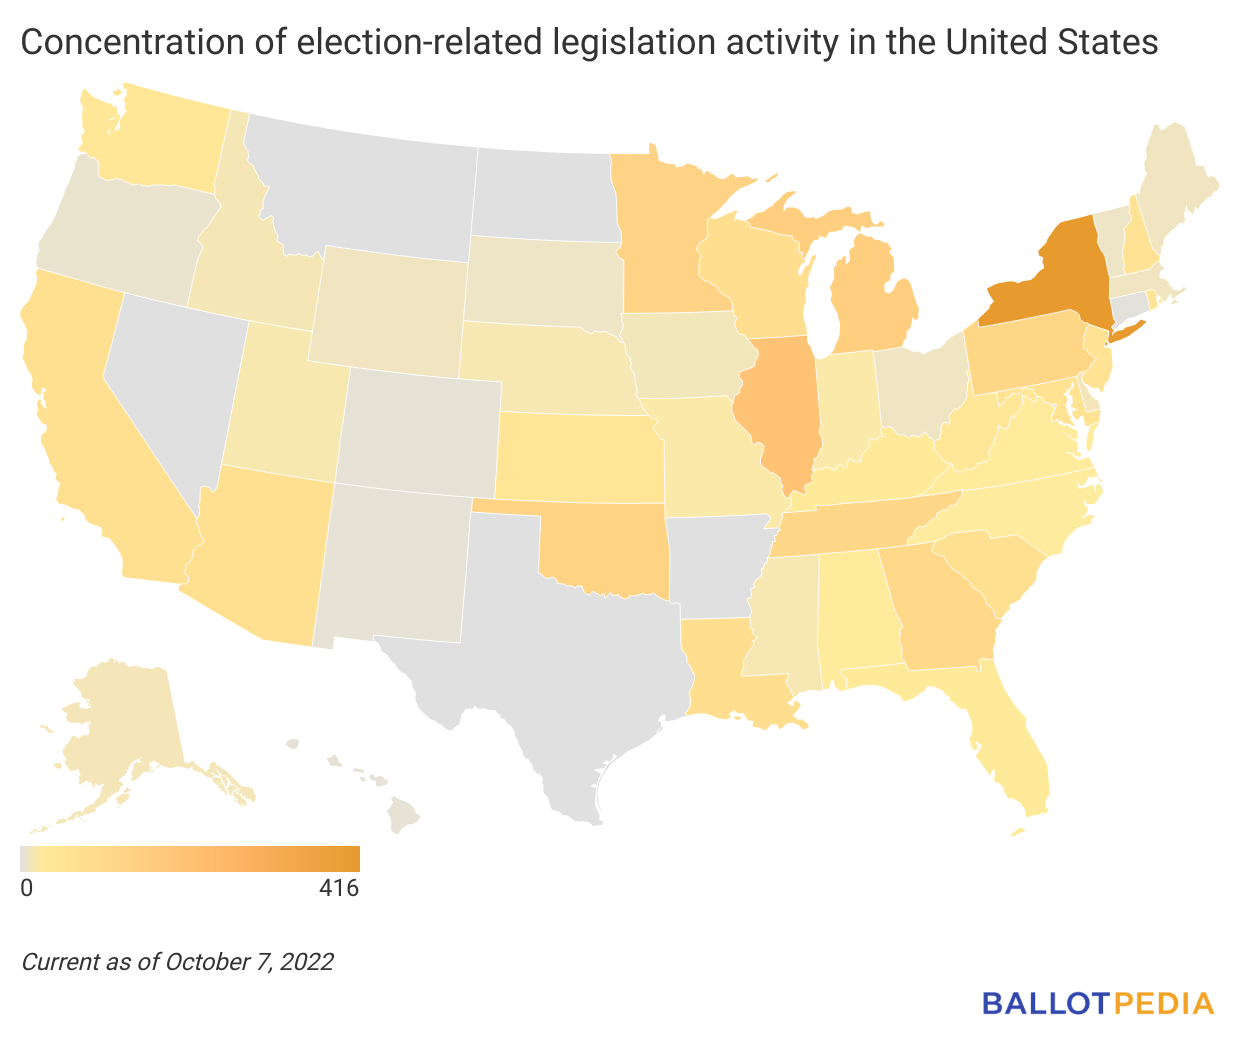
Concentration of activity
The map below visualizes the concentration of legislative activity across the nation. A darker shade of yellow indicates a higher number of relevant bills that have been introduced. A lighter shade of yellow indicates a lower number of relevant bills.
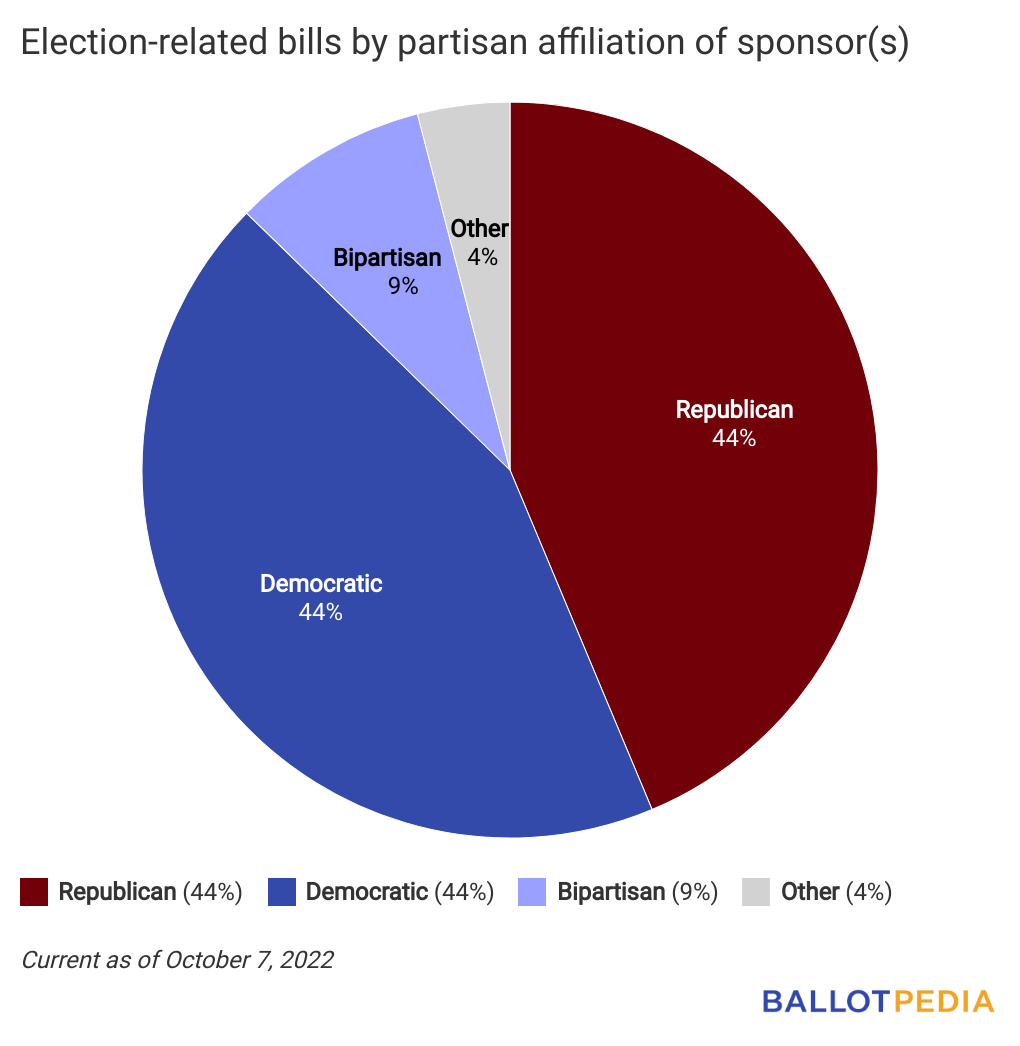
Partisan affiliation of sponsor(s)
The pie chart below visualizes the partisan affiliation of bill sponsors.
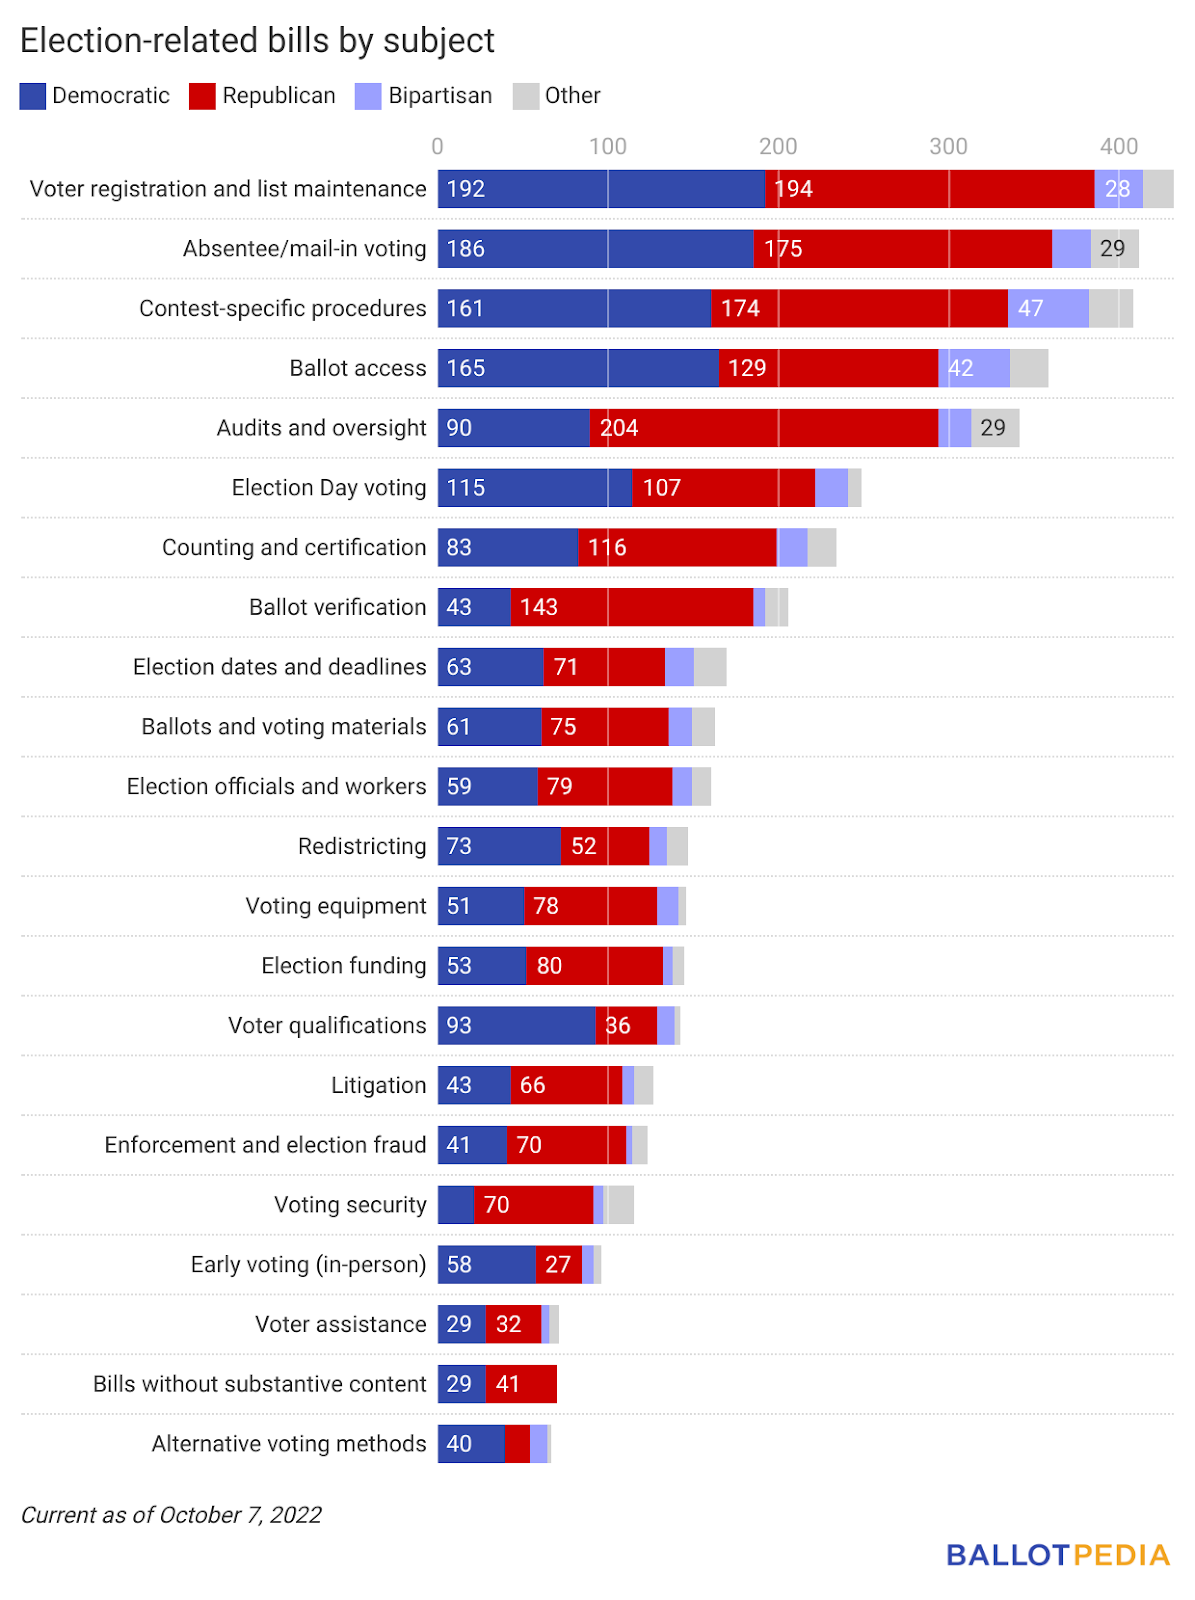
Bills by topic
The chart below presents information on the total number of bills dealing with particular topics. The number listed on the blue portion of each bar indicates the number of Democratic-sponsored bills dealing with the subject in question. The number listed on the red portion of the bar indicates the number of Republican-sponsored bills. The purple and gray portions of the bar indicate the number of bipartisan-sponsored bills and bills with unspecified sponsorship, respectively. Note that the numbers listed here will not, when summed, equal the total number of bills because some bills deal with multiple topics.