

Welcome to the Tuesday, May 16, Brew.
Here’s what’s in store for you as you start your day:
- Nearly 1 million residents per Senate district in California
- Ballotpedia is covering elections today in 10 states
- 42 candidates filed for federal and statewide offices last week
Nearly 1 million residents per Senate district in California
After the 2020 census, California's 40 state Senators represent more than 39.5 million people—an average of 989,419 people per district. Each member of the 31-member Texas State Senate represents an average of 941,396 people. Both of those figures are larger than the average number of people represented by members of the U.S. House of Representatives—761,169 people per district.
Now that redistricting is behind us in most states, let’s take a look at the various district sizes and population represented by state legislators.
The largest population per district ratio among state House districts is also in California, where the Golden State's 80 Assembly members represent an average of 494,709 people per district. Texas is again in second place as the 151 members of its state House represent an average of 194,555 people.
There are 1,973 state senators nationwide after the 2020 census—which averages to 167,820 Americans per senator. The country's 5,413 state representatives represent an average of 61,169 people each.
Among state Senates, North Dakota's senators represent the fewest people per district, an average of 16,589 per senator. Among state Representatives, New Hampshire's represent the fewest at 3,448 people each.
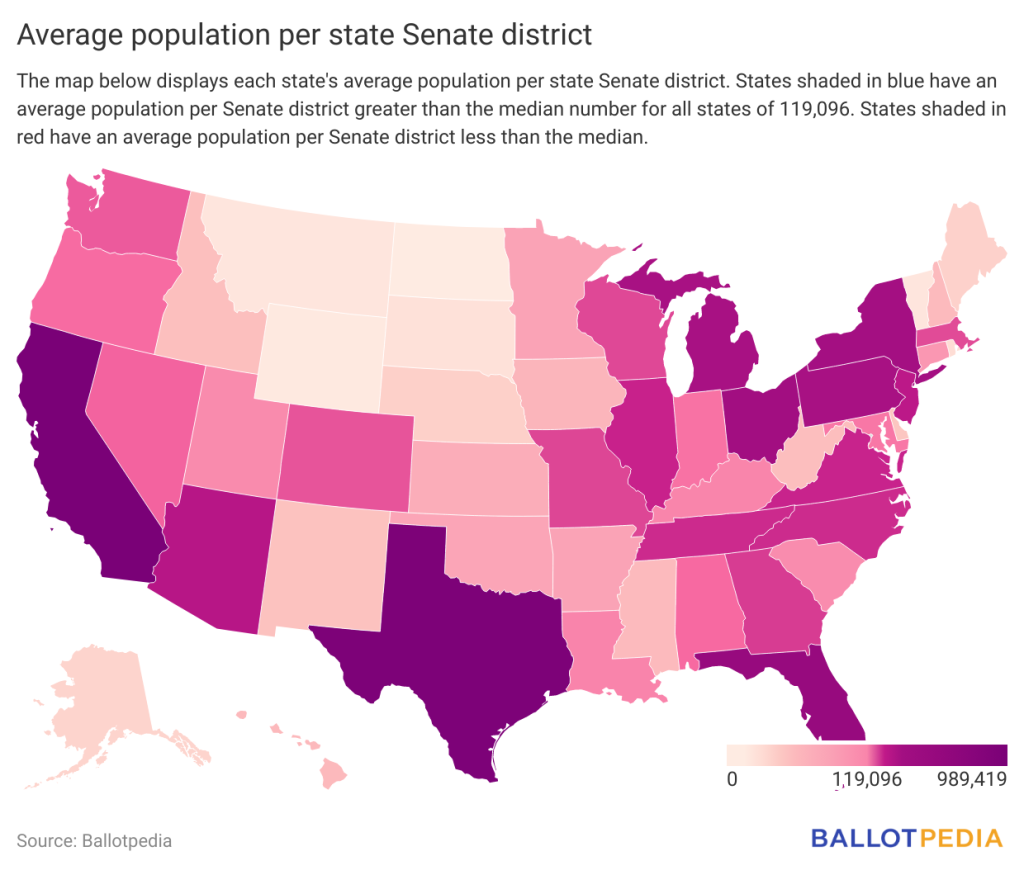
Here are the states with the largest average number of residents per state Senate district:
- California - 989,419 people per district
- Texas - 941,396
- Florida - 539,263
- Ohio - 357,844
- New York - 320,885
Here are the states with the smallest average number of residents per state Senate district:
- North Dakota - 16,589
- Wyoming - 18,636
- Vermont - 21,450
- Montana - 21,708
- South Dakota - 25,365
Here are the states with the largest average number of residents per state House district:
- California - 494,709 people per district
- Texas - 194,555
- Florida - 179,754
- New York - 134,772
- Arizona - 119,315
Here are the states with the smallest average number of residents per state House district:
- New Hampshire - 3,448
- Vermont - 4,290
- North Dakota - 8,295
- Maine - 9,030
- Wyoming - 9,318
Wyoming was the only state that changed its number of legislators during redistricting after the 2020 census. The state added one Senate district and two House of Representatives districts. All other states kept their number of legislators the same. Minnesota has the largest state Senate with 67 members, and New Hampshire has the largest state House with 400 members.
Forty-six of the 50 states saw the average number of residents per legislator increase after the 2020 census compared to the 2010 census. Thirteen states had the average number of residents per legislator increase by more than 10% as compared to after the 2010 census, with four—Utah, Idaho, Texas, and North Dakota—having increases of more than 15%. In three states—Illinois, Mississippi, and West Virginia—the ratio of residents per legislator decreased since their population was lower after the 2020 census compared to the 2010 census. Wyoming’s population per legislator decreased 1.6% because the state increased its number of legislators.
Ballotpedia is covering elections today in 10 states
Today is one of the busiest election days of 2023, with voters deciding statewide, legislative, or local races in at least 10 states. Headlining today’s contests are statewide primaries in Kentucky and Pennsylvania.
Over the past several weeks, we’ve covered many of these races here in the Brew, but here’s a quick summary of today’s top contests:
Voters in Kentucky will decide party primaries for six statewide offices, including governor, where 12 candidates are running in the Republican primary. Incumbent Gov. Andy Beshear (D) faces two challengers for the Democratic nomination.
Beshear was first elected in 2019, defeating incumbent Gov. Matt Bevin (R), 49.2% to 48.8%. Beshear previously served one term as attorney general from 2015 to 2019 and is the son of former Gov. Steve Beshear (D).
We profiled the Republican gubernatorial primary in yesterday’s Brew, but if you didn’t get a chance to read that edition, State Attorney General Daniel Cameron, former U.S. Ambassador to the United Nations Kelly Craft, and Agriculture Commissioner Ryan Quarles lead in polling and media attention.
Former President Donald Trump (R) endorsed Cameron last year, while U.S. Rep. James Comer (R-Ky.) and U.S. Sen. Ted Cruz (R-Texas) endorsed Craft. Quarles has the endorsements of four state senators, 22 state representatives, and other local state officials.
Kentucky—alongside Kansas, Louisiana, and North Carolina—is one of four states with a Democratic governor that Trump (R) won in 2020. That year, Trump defeated Joe Biden (D) 62% to 36% in the state. The last Democratic presidential nominee to carry the state was former President Bill Clinton in 1996.
Nine candidates are running in the Democratic primary for mayor of Philadelphia on May 16. The winner will face David Oh—the only candidate seeking the Republican nomination—in the Nov. 7 general election. Incumbent Jim Kenney (D), first elected in 2015, is term-limited.
Jeff Brown, Allan Domb, Helen Gym, Cherelle Parker, and Rebecca Rhynhart lead in fundraising and media attention.
Domb, Gym, Parker, and Rhynhart all held elected positions in the city until beginning their mayoral campaigns last year. Philadelphia has a resign-to-run rule where candidates who are city employees or hold public office in the city must resign from those positions before seeking another office.
Unlike many other mayoral elections we’ve mentioned in the Brew, Philadelphia’s are partisan, meaning the winner of this primary will appear on the general election ballot with a party label. Philadelphia has not elected a Republican mayor since Bernard Samuel, whose term ended in 1952.
Of the country’s 100 most-populous cities, Philadelphia is one of 62 with a Democratic mayor. Twenty-six have Republican mayors, and 10 are independent or nonpartisan. Ballotpedia could not identify the partisan affiliation of two mayors.
Democratic and Republican voters in Pennsylvania will make their picks for the state’s upcoming supreme court election in November.
These upcoming primaries will determine the major party candidates running to fill a vacancy on the court created after Chief Justice Max Baer (D) died last year. The winner in November will be elected to a 10-year term on the court.
Democrats have controlled the Pennsylvania Supreme Court since 2015 when they established a 5-2 majority. The outcome of this election will not affect the court’s governing majority. But it will set the stage for the upcoming 2025 elections when three justice’s terms—all Democrats—are set to expire.
Both of this year’s primaries have two candidates. Deborah Kunselman and Daniel McCaffery, both judges on the Pennsylvania Superior Court, are running in the Democratic primary. Patricia McCullough and Carolyn Tornetta Carluccio are running in the Republican primary. McCullough is a judge on the Pennsylvania Commonwealth Court. Carluccio is a judge on Montgomery County’s Court of Common Pleas.
Pennsylvania is one of eight states that use partisan elections for state supreme court justices. And it's one of two states holding supreme court elections this year. Wisconsin voters elected a new justice on April 4.
Voters in Arizona, Colorado, Florida, Georgia, Idaho, New Hampshire, New York, and Oregon also go to the polls today. Click here to read about all the key elections taking place on May 16. And for a full list of the races Ballotpedia will be tracking in the months ahead, bookmark our upcoming elections calendar at the link below.
42 candidates filed for federal and statewide offices last week
Last week, 42 candidates filed to run for congressional and state offices—including for elections in 2023, 2024, 2025, and 2026. Two weeks ago, we tracked 37 candidates who declared for congressional and state offices.
This year, we’ve tracked 654 declared candidates for federal and statewide offices.
Here’s a breakdown of the candidates who declared last week:
Of the partisan nature of the declared candidates:
- 24 are Democrats.
- 18 are Republicans.
Of the offices tracked:
- 30 candidates filed for Congress.
- 4 candidates filed for governorships.
- 8 filed for a lower state executive office.
Between March 6 and March 27, we tracked an average of 21 candidates who filed for federal or state elections. Between April 3 and April 24, that average increased to 33 candidates.
We cover elections for tens of thousands of offices across the country, and part of that work includes keeping tabs on the candidates who file to run for those offices. We’ll periodically update you on how many candidates are signing up to run for state and congressional offices. We process both official and declared candidates.
Click here to read more about our definition of candidacy. Click the link below to see a list of all declared candidates for federal elections in 2024.