

Welcome to the Friday, December 8, Brew.
By: Samuel Wonacott
Here’s what’s in store for you as you start your day:
- Republicans won 59% of all school board seats in Pennsylvania to Democrats’ 39%
- FairVote Director of Research and Policy Deb Otis makes the case for RCV in part two of our On the Ballot series
- #FridayTrivia: What was the recall success rate between 2010 and 2022?
Republicans won 59% of all school board seats in Pennsylvania to Democrats’ 39%
Ballotpedia covered every school board election in seven states on Nov. 7: Colorado, Kansas, Minnesota, Ohio, Pennsylvania, Virginia, and Washington. We’re continuing our deep dive into election results in each of those states.
Over the last few weeks, we looked at Minnesota, Virginia, and Colorado. Today, we’ll take a look at Pennsylvania.
Unlike the other states we’ve looked at since Nov. 7, Pennsylvania is one of four that hold partisan school board elections by default, along with Alabama, Connecticut, and Louisiana. It is the country’s most populous state with partisan school board elections.
Although candidates appear on the ballot with a party label, it isn’t always clear what that label means. The state’s election rules allow candidates to run in both the Democratic and Republican primaries in a process called cross-filing. Candidates who win both primaires appear on the general election ballot as Democratic/Republican. We used Pennsylvania’s publicly available voter registration information to get around that ambiguity.
Here's what we found.
Republicans won 59% of all school board seats up for election on Nov. 7 to Democrats’ 39%.
Each of the state’s 500 school districts held at least one election (except for Philadelphia, where the mayor appoints school board members). Altogether, Pennsylvania held 1,059 school board elections for 2,611 (or 60%) of all 4,338 seats in the state.
The size of the Republican victory is due partly to geography and the distribution of voters. In the 499 districts that hold elections, registered Republicans are either a majority or plurality of voters in 355, while registered Democrats lead in the remaining 144.
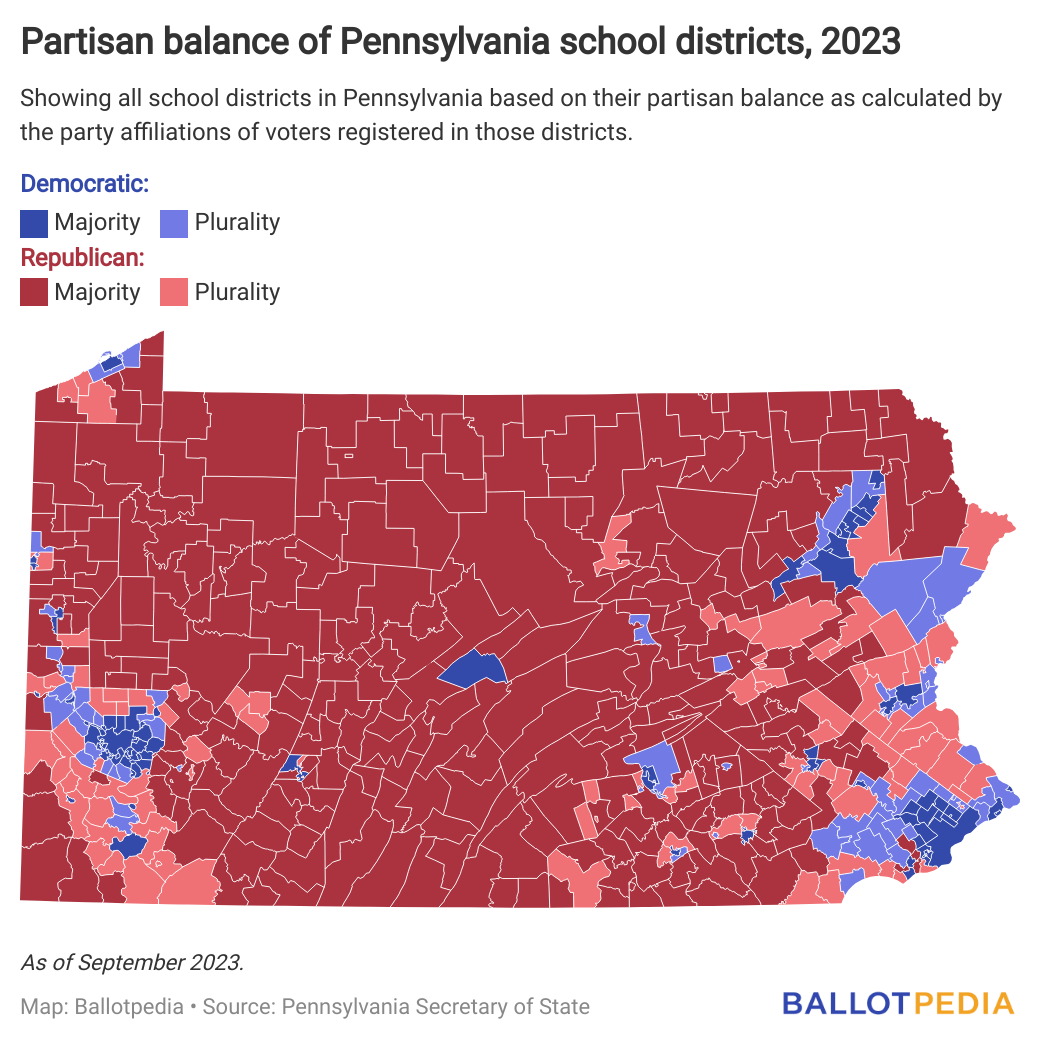
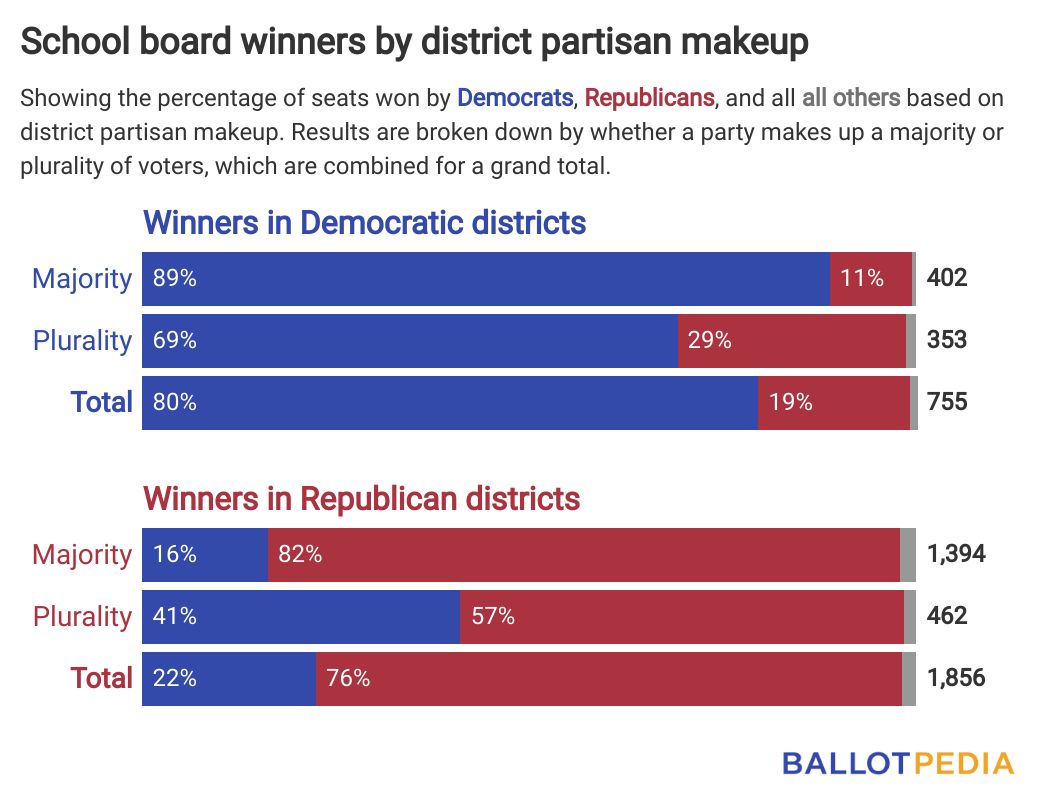
Of the seats up for election, 1,856 (71%) were in Republican-leaning districts, and 755 (29%) were in Democratic-leaning districts.
Democratic candidates won 80% of the seats in Democratic districts and Republican candidates won 76% in Republican districts.
There was one Democratic district where only Republicans won: Chartiers Valley in the Pittsburgh area.
And there were nine Republican districts where only Democrats won, including two we were covering closely: Central Bucks and Pennridge. The others were Carlisle Area, Derry Township, Frazier, Manheim Township, Owen J. Roberts, Perkiomen Valley, and Unionville-Chadds Ford.
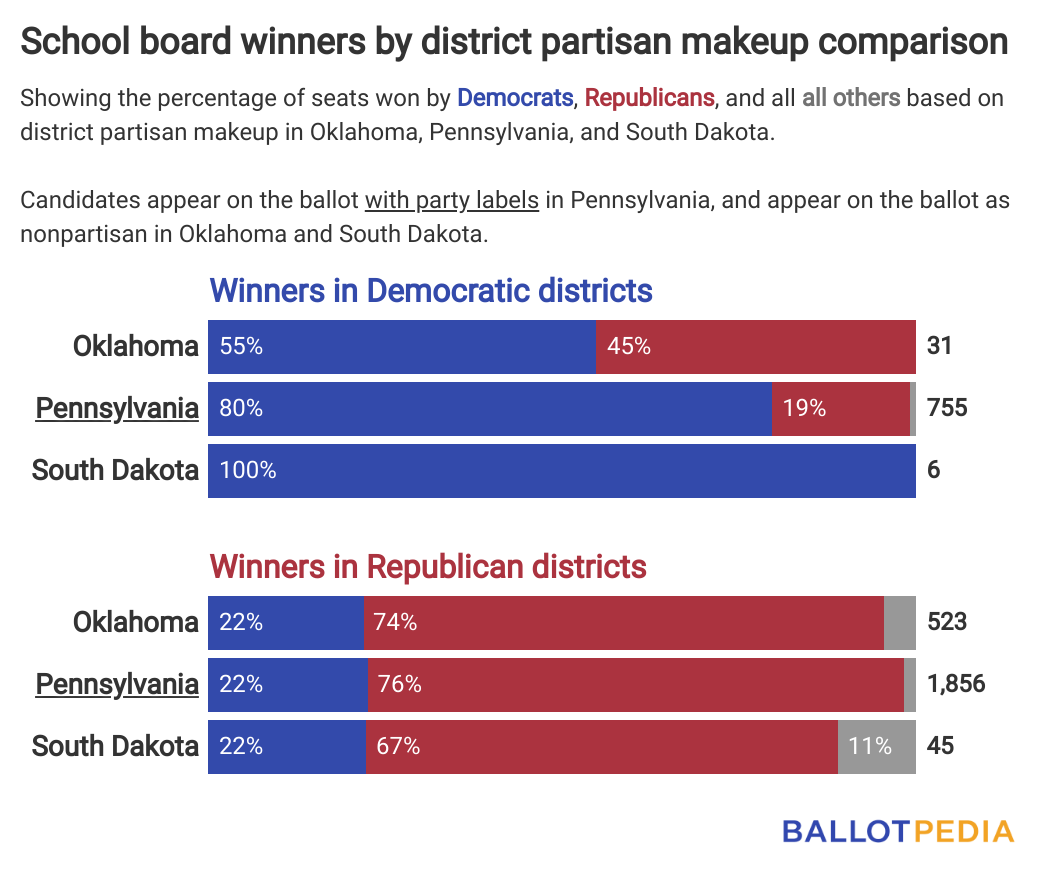
Despite having party labels on the ballot, Pennsylvania’s results closely resemble those in states that hold nonpartisan school board elections.
In both Oklahoma and South Dakota, our earlier analyses found that Democrats won most of the seats in Democratic districts and Republicans won most of those in Republican districts even though those candidates appeared on the ballot without any party labels.
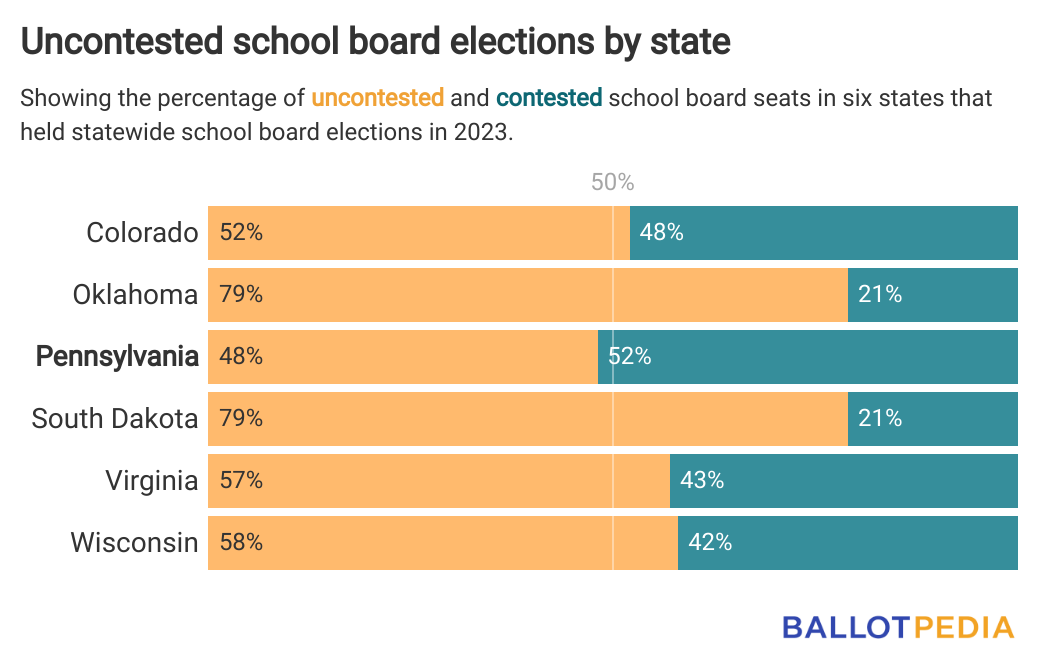
One area where Pennsylvania broke from most other states we have analyzed so far this year is in the number of uncontested school board elections.
In Pennsylvania, 48% of seats were uncontested, or 1,258 seats. That’s a lower percentage than in Colorado, Oklahoma, South Dakota, Virginia, and Wisconsin—the other states we’ve analyzed so far this year. In those states, between 52% and 79% of elections were uncontested.
Eighty-five seats were guaranteed to write-in candidates because there were fewer candidates on the ballot up for election. There were no candidates in 26 elections.
But just because a write-in candidate received the most votes doesn’t mean that person will assume office. In Pennsylvania, winning write-in candidates must indicate whether they want to hold that position. If a person declines, the seat becomes vacant.
Click the link below to explore more of our findings from Pennsylvania’s school board elections.
FairVote Director of Research and Policy Deb Otis makes the case for RCV in part two of our On the Ballot series
On the Ballot, Ballotpedia’s weekly podcast covering all things elections and American politics, is taking a deep dive into ranked-choice voting (RCV). The four-part series takes a comprehensive look at the emergent electoral system, featuring four guests taking on different parts of—and perspectives on—the RCV story.
In our first installment, released last week, Ballotpedia Staff Writer Joe Greaney introduced RCV and walked us through this year’s legislation and ballot measures—and what we can expect to see in 2024. You can listen here.
Yesterday, we released part two—a conversation with FairVote’s Deb Otis. Otis, FairVote’s Research Director, explains the case for adopting RCV nationwide. Otis unpacks how RCV fared in November elections, goes over the voting system’s purported benefits, and addresses some of the most common concerns she hears from voters and policy makers.
Ballotpedia recently unveiled a new RCV Info Hub, a resource to address the lack of neutral resources to help voters understand what RCV is, how it’s used, its history, and why people support or oppose its use.
Keep an eye out for future On the Ballot episodes featuring:
- Trent England from Save Our States diving into the arguments against RCV—episode drops on Dec. 12
- Jack Santucci from Queens College CUNY with a comprehensive view of what’s to come for RCV— episode releases on Dec. 14.
You can listen at the link below, or wherever you listen to podcasts.
#FridayTrivia: What was the recall success rate between 2010 and 2022?
In the Monday Brew, we brought you a story about East Cleveland Mayor Brandon King (D), who survived his second consecutive recall election on Dec. 5. Voters rejected the effort to recall King 70.1% to 29.9%. East Cleveland voters first rejected an effort to recall King in November 2022, though the election was much closer—50.4% to 49.6%.
King’s recall was one of 57 mayoral recall efforts we have covered or will cover this year. On Dec. 12, recall elections against four of the six members of the Sargent Public Schools Board of Education in Nebraska will take place.
Overall, between 2010 and 2022, we covered an average of 211 recall efforts against an average of 347 officials each year.
What was the average recall success rate between 2010 and 2022?