

Welcome to the Friday, December 15, Brew.
By: Samuel Wonacott
Here’s what’s in store for you as you start your day:
- 64% of Washington’s school board seats were uncontested last month
- Polls close for the Official Holiday Cookie primary today at 5:00 pm ET!
- #FridayTrivia: What percentage of local elections went uncontested in 2023?
64% of Washington’s school board seats were uncontested last month
Over the last few weeks, we’ve walked you through our research on Nov. 7 school board election data in Colorado, Minnesota, Ohio, Pennsylvania, Virginia, and Ohio—six of the 10 states where we covered all school board elections this year. This data has given us a unique insight into the elements of school board elections—such as partisan dynamics in nonpartisan races, open seats, defeated incumbents, and more—that have been underexplored in past cycles.
Today, we’re continuing our series with a deep dive into Washington’s Nov. 7 school board elections. Here are the top highlights from our just-published report:
64% of Washington’s school board seats were uncontested
There were 881 school board seats up for election in Washington this year—more than half of the state’s 1,398 seats.
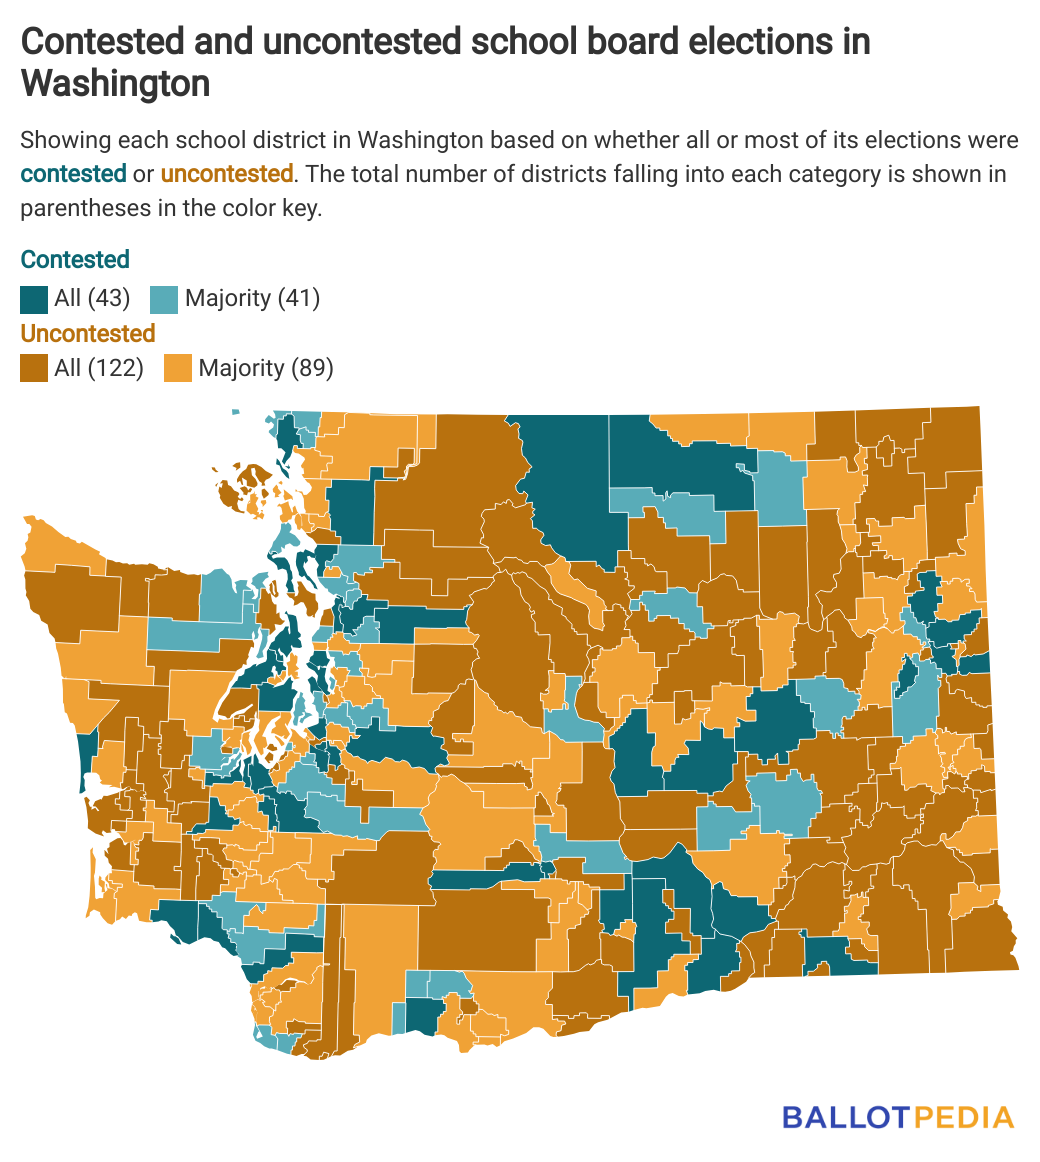
But 565 of those seats—64% of those up for election—were uncontested, meaning there was just one candidate on the ballot.
Of the 295 districts that held elections, in 211, all or most of the seats were uncontested. That’s compared to 84, where all or most were contested.
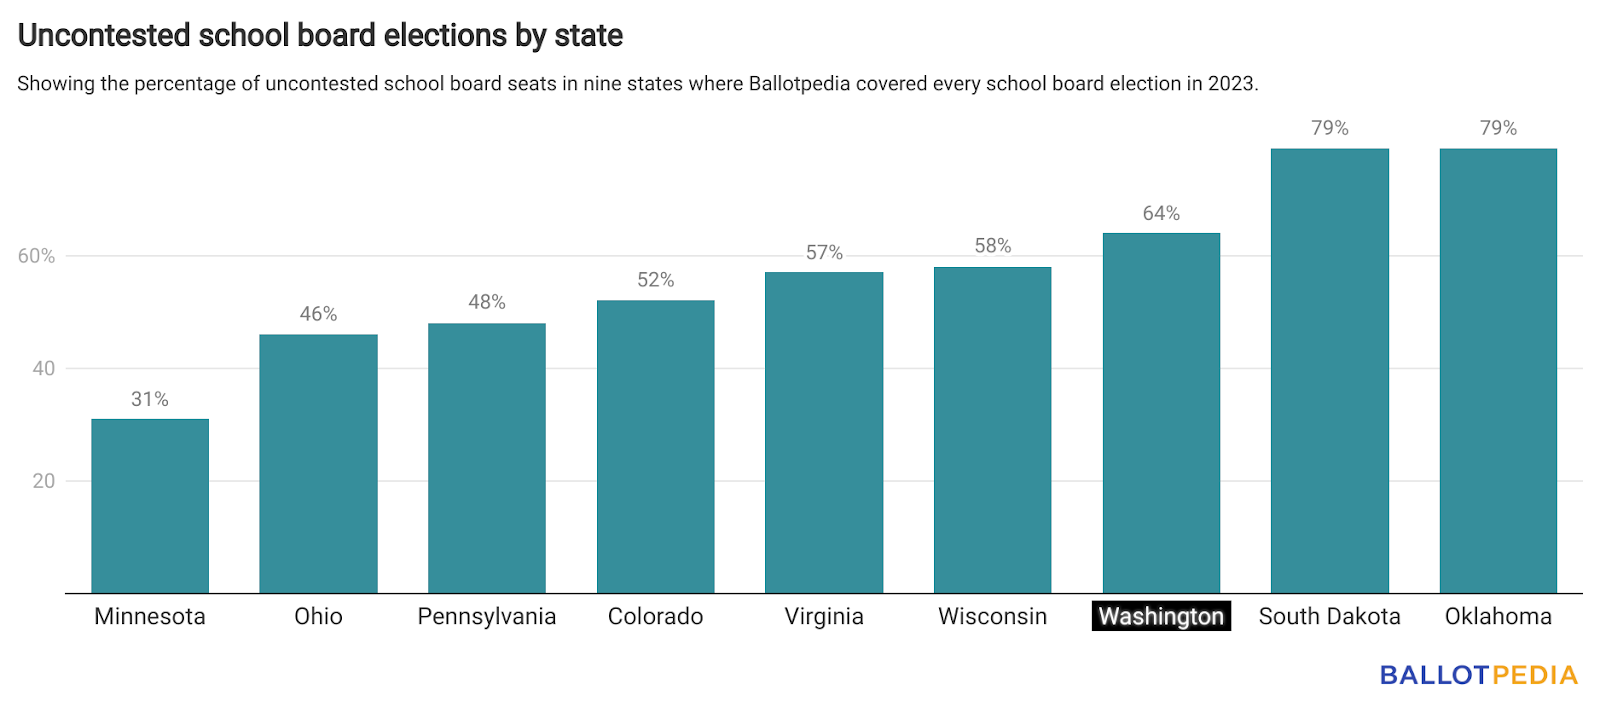
That’s one of the higher rates of uncontested elections we’ve seen this year. In Oklahoma and South Dakota, 79% were uncontested, and more than half were uncontested in Colorado, Virginia, and Wisconsin. Only Minnesota, Ohio, and Pennsylvania had more contested rather than uncontested seats.
Because Washington does allow write-ins in general elections, there was a chance candidates might lose even if they were the only name on the ballot. However, write-in candidates won only two of the 881 seats up for election. In both cases, the winning candidate was an incumbent.
Overall, 90% of the 684 incumbents who ran for re-election won. But 67% of those incumbents were uncontested.
Looking just at the 223 incumbents who ran in contested elections, the win rate drops to 69%. That’s five percentage points lower than the 74% incumbent win rate in our historical data from 2018 to 2022.
Liberal-endorsed candidates won more seats than candidates backed by conservative organizations and individuals
Like school board elections in most states, Washington’s are officially nonpartisan. However, we gathered endorsement data from nearly 500 individuals and organizations that backed candidates on Nov. 7, allowing us to paint a picture of the ideological dynamics in those races.
A quick caveat. Endorsements are rare in uncontested elections, meaning that most winning Washington candidates, most of whom ran unopposed, did not garner any endorsements. About 77% of winning candidates received no endorsements.
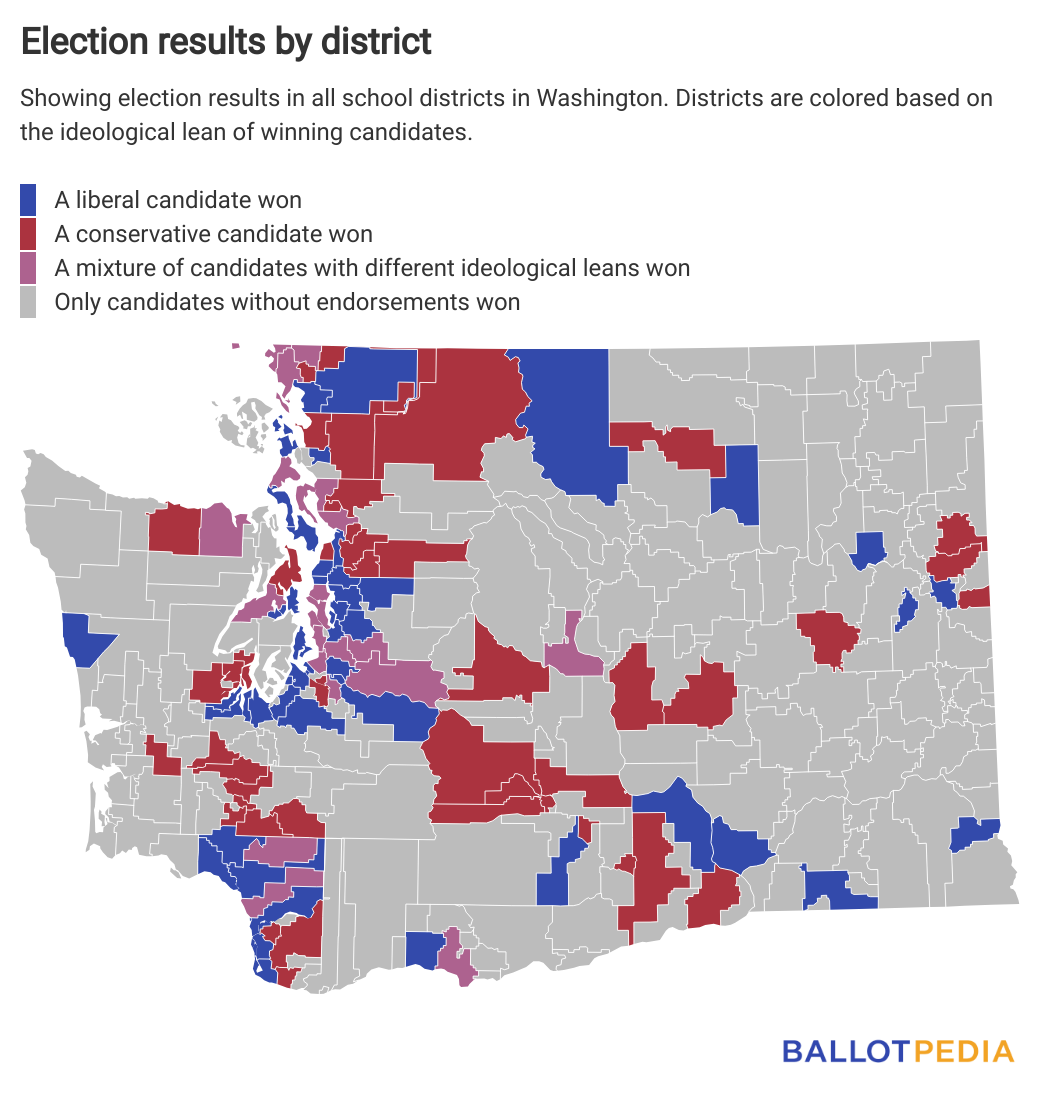
Of the 204 winners who received endorsements (or 23% of all winning candidates):
- Candidates backed by liberal groups and organizations won 54% of seats.
- Candidates backed by conservative groups and organizations won 41%.
About 5% of winning candidates received endorsements from leftwing and rightwing organizations or individuals or couldn’t be classified based on the endorsements we found.
Based on the endorsements we collected, we found 206 races that featured candidates with contrasting ideological leans. In those races, liberal candidates had a 71% win rate compared to a 42% win rate for conservative candidates.
Use the link below to learn more about Washington’s school board elections.
Polls close for the Official Holiday Cookie primary today at 5 p.m. ET!
Polls opened for our annual Official Holiday Cookie primary election on Tuesday, and they close tonight at 5 p.m. ET!
If you have yet to cast your vote, you still have a few more hours to help narrow the field for the general election. The three candidates who receive the most votes in the primary will face off in the general, which will run Dec. 18-21.
The winner will be announced on Dec. 22.
Here are the candidates:
- Sugar Cookie
- Chocolate chip cookie
- Chocolate peppermint bark cookie
- Gingerbread cookie
- Peanut butter blossom
- Snickerdoodle
- Thumbprint cookie
- Oatmeal Raisin
You can read their platforms here.
We’ve crowned an Official Holiday Cookie since 2019. Last year, voters selected Gingerbread Cookie as the Official Holiday Cookie. Gingerbread received 32% of the vote, beating Sugar Cookie (30%), Snickerdoodle (26%), and several write-in candidates. In 2021, following an unsettling incident in which salt was used instead of sugar, voters ousted incumbent Sugar Cookie in a recall election.
Which cookie will relish in sweet, sweet victory this year?
#FridayTrivia: What percentage of local elections went uncontested in 2023?
In the Wednesday Brew, we discussed our new report on competition in this year’s local elections. Our report analyzed 10,000 local general elections across 17 states, including races for school boards, city and local council members, county commissioners, judges, clerks, treasurers, auditors, assessors, and other local offices.
Compared to the last three cycles, we found that 2023 had the highest percentage of uncontested elections. For example, in 2021, 27.1% of local elections were uncontested. We define uncontested elections as any election where the number of candidates qualified for the ballot is equal to or less than the number of seats up for election.
Nationwide in 2022, 3% of congressional elections, 11% of state executive races, and 32% of state legislative races were uncontested. And in 2021, 5.9% of state legislative races were uncontested.
What percentage of the 10,000 elections we looked at this year were uncontested?