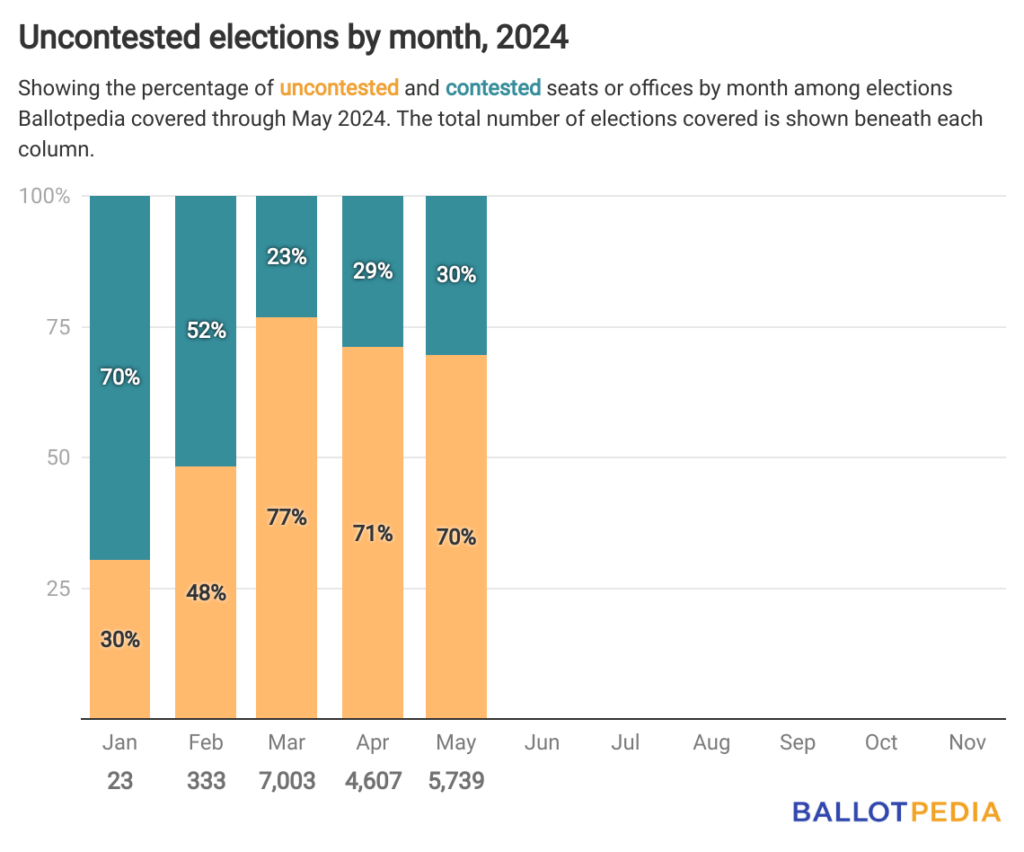
Throughout May, Ballotpedia covered 5,793 elections in 23 states, 70% of which were uncontested.
That’s down from April when 71% of the 4,607 covered were uncontested.
Ballotpedia defines an uncontested election as one where the number of candidates running is less than or equal to the number of seats up for election. This analysis does not account for write-in candidates.
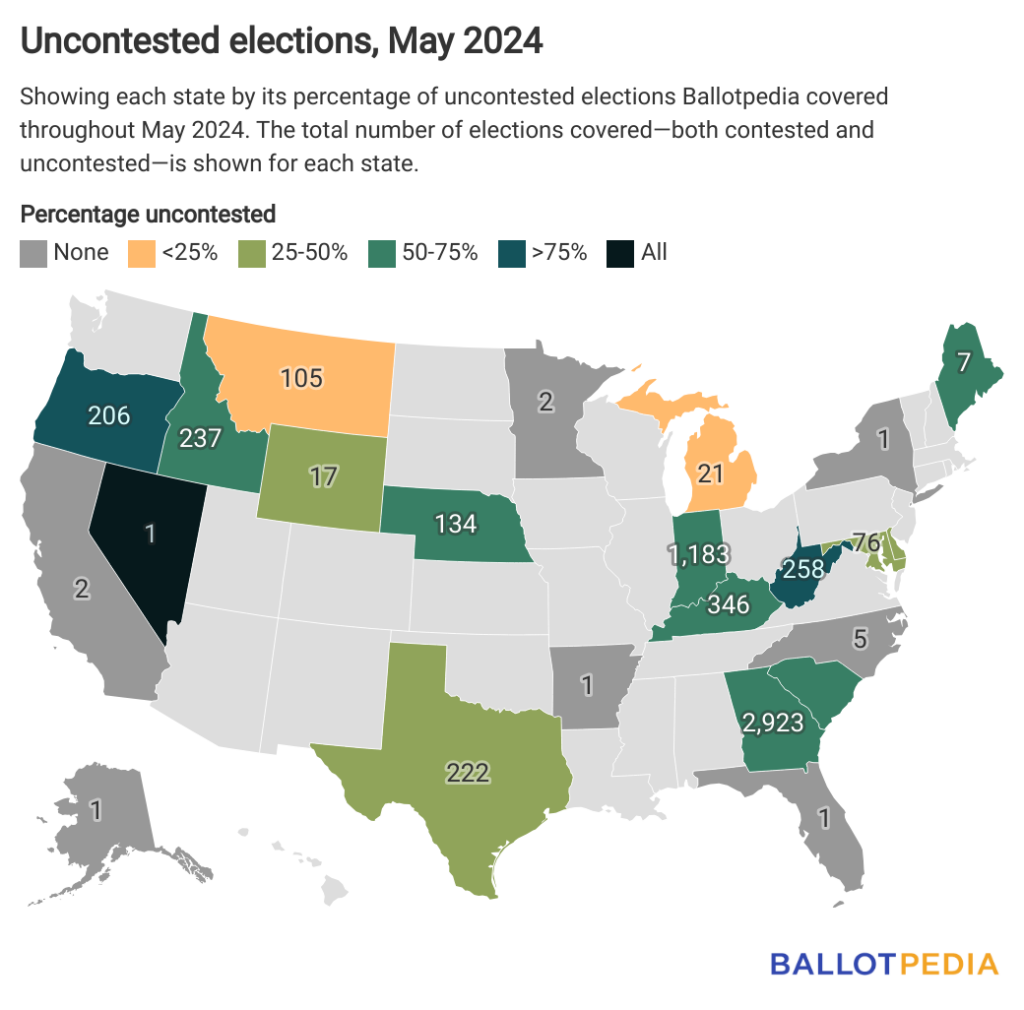
Ballotpedia covered the most elections in Georgia last month where 74% of the 2,923 elections were uncontested. Indiana had the second-most number of uncontested elections, with the rate mirroring the national average of 70%.
In six of the seven states with more than 200 elections covered, the rate of uncontested elections ranged from 70% to 76%. The outlier was Texas, where 36% of the 222 elections covered were uncontested.
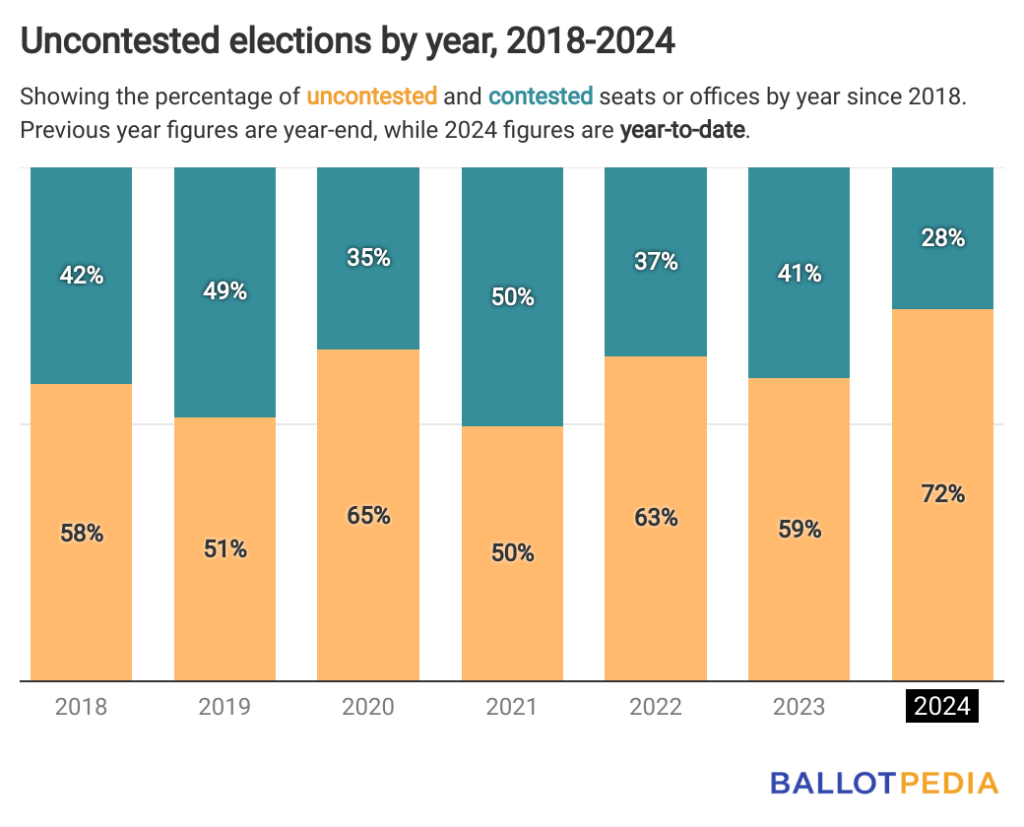
May’s rate of uncontested elections was greater than the 58% average rate identified between 2018 and 2023.
It also brings the year-to-date rate of uncontested elections to 72%.
For comparison, since 2018, each year has had more elections uncontested than contested except for one, in 2021, when 50.4% of the elections Ballotpedia covered were contested.