

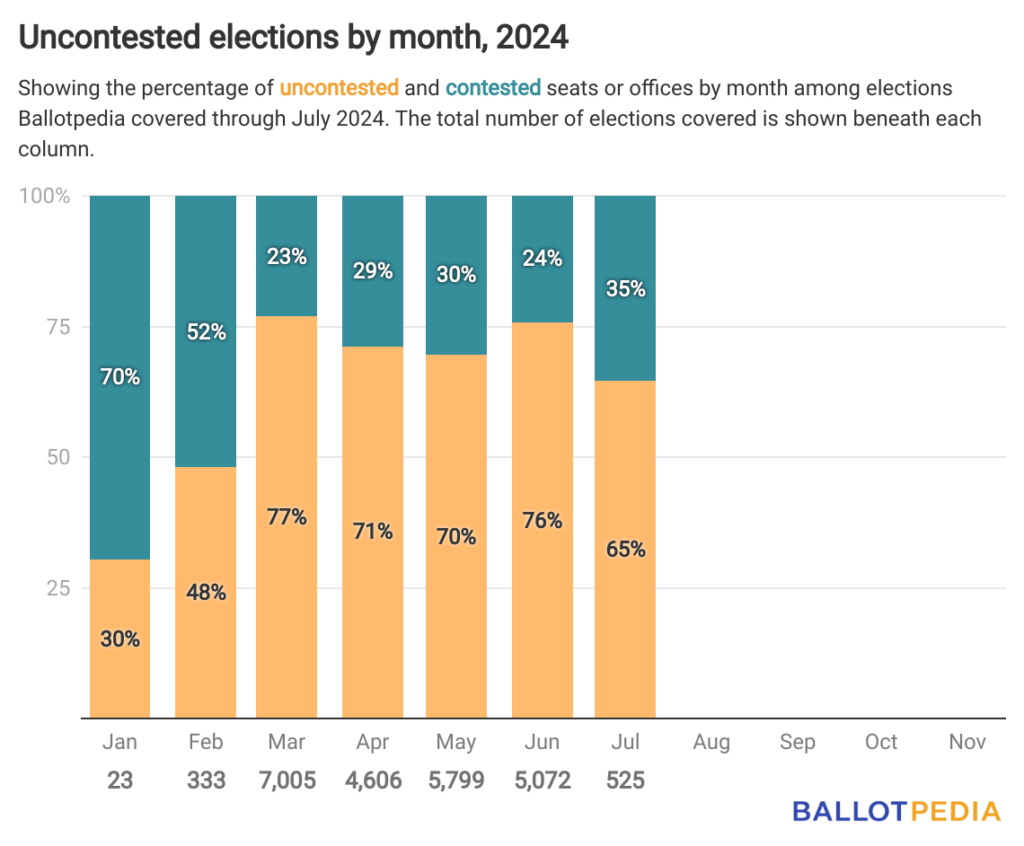
Throughout July, Ballotpedia covered 525 elections in 11 states, 65% of which were uncontested.
That’s down from June, when 76% of the 5,072 covered were uncontested.
Ballotpedia defines an uncontested election as one where the number of candidates running is less than or equal to the number of seats up for election. This analysis does not account for write-in candidates.
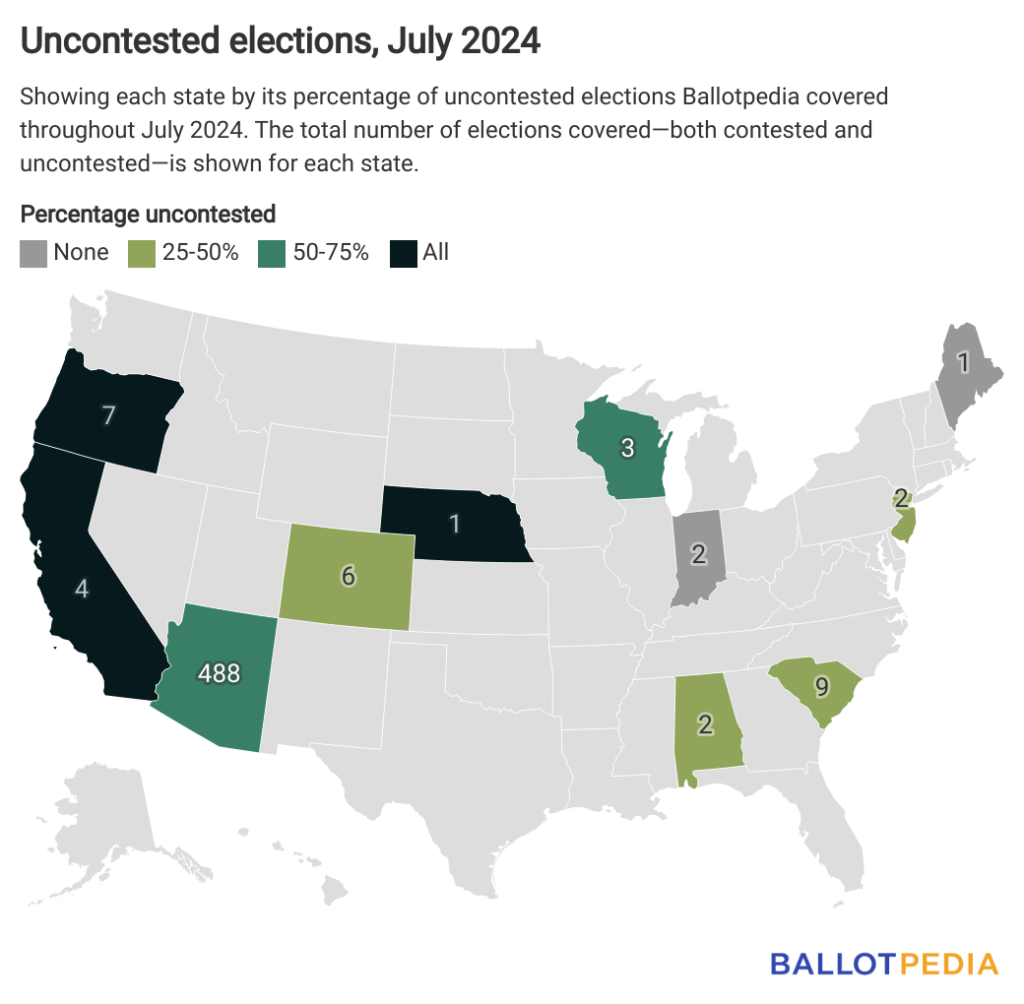
93% of the 525 elections Ballotpedia covered during July were in Arizona. Of the 488 elections covered, 317 (65%) were uncontested.
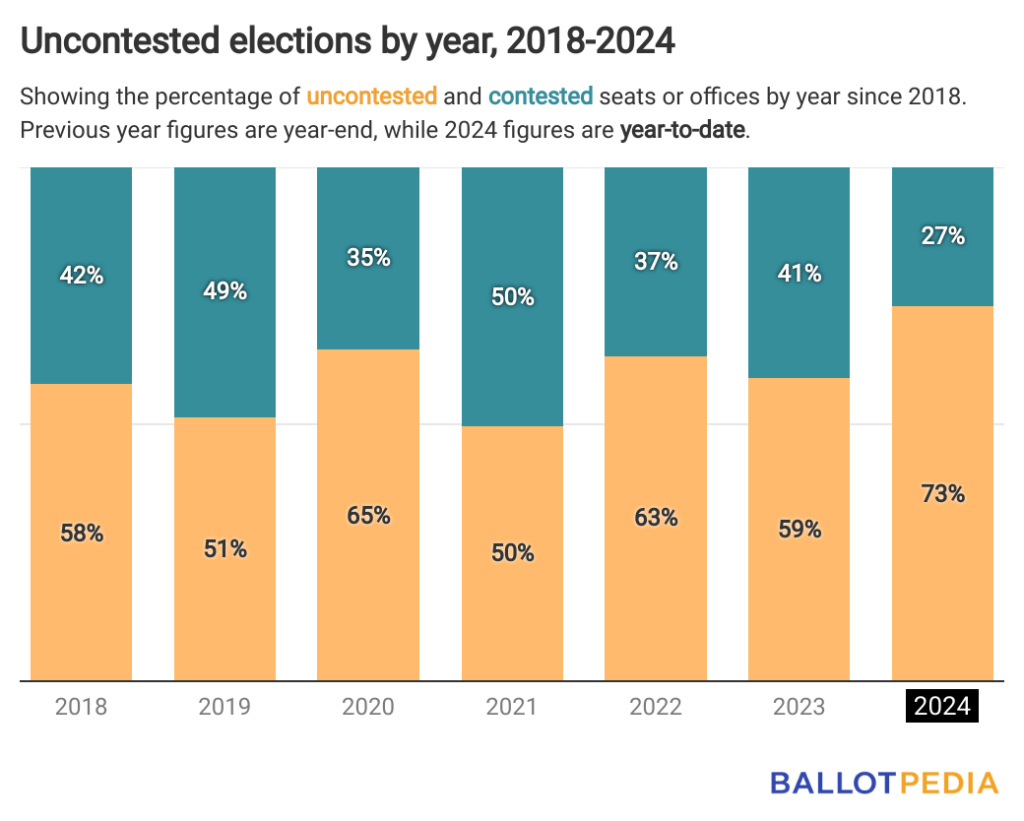
July’s rate of uncontested elections was greater than the 58% average rate identified between 2018 and 2023.
It also brings the year-to-date rate of uncontested elections to 73%.
For comparison, since 2018, each year has had more uncontested than contested elections except for one, in 2021, when 50.4% of the elections Ballotpedia covered were contested.
Local judicial elections have had the least competition so far this year. Ballotpedia has covered 2,242 such elections to date in 2024, 1,928 (86%) of which were uncontested.
And that trend appears poised to continue through the rest of the year.
While we are still gathering candidate information for upcoming elections, based on the data available today, Ballotpedia will cover 3,678 local judicial elections by the end of the year, 3,263 (89%) of which were or will be uncontested.