

According to Ballotpedia’s annual competitiveness analyses, midterm election years like 2026 tend to feature more open state legislative seats than presidential election years.
Voters across 46 states will choose who will represent them in 6,155 state legislative districts this November. On March 3, 2026, three states—Arkansas, North Carolina, and Texas—will hold the first primary elections for those races.
Since 2010, Ballotpedia has assigned each state a score every year based on three factors indicative of choice on the ballot:
- Open seats: The percentage of seats guaranteed to be won by a newcomer.
- Incumbents in contested primaries: The percentage of seats where voters could choose a newcomer over an incumbent.
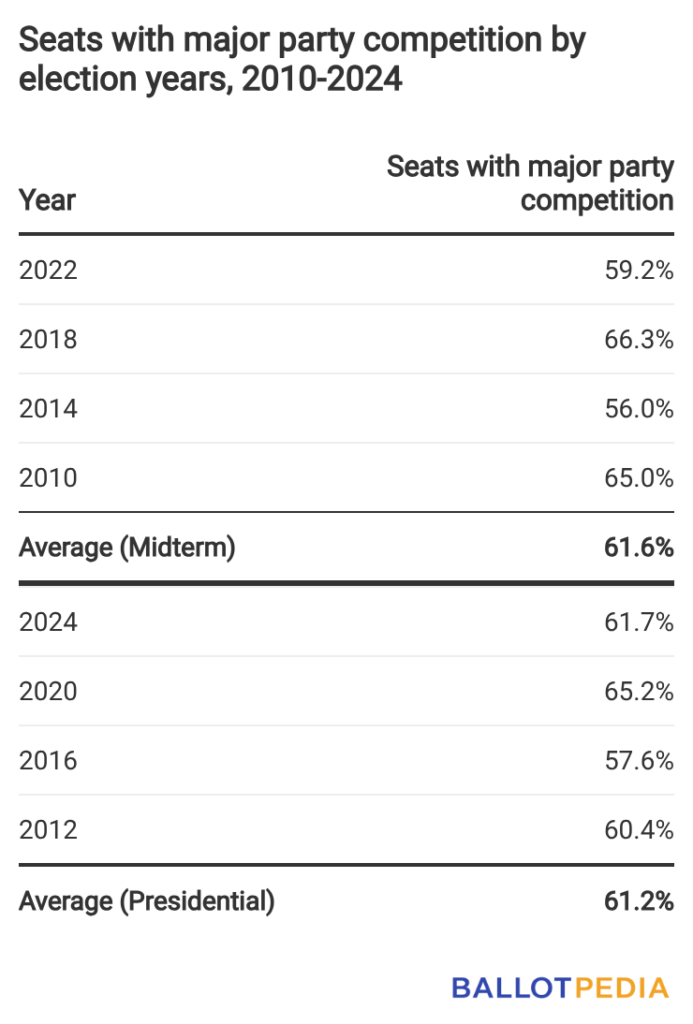
- Seats with major party competition: The percentage of seats where voters could choose between a candidate from both major parties.
In the four previous midterm years, those competitiveness scores were higher on average than during the previous four presidential election years. Three of the four most competitive years since 2010 were midterm years.
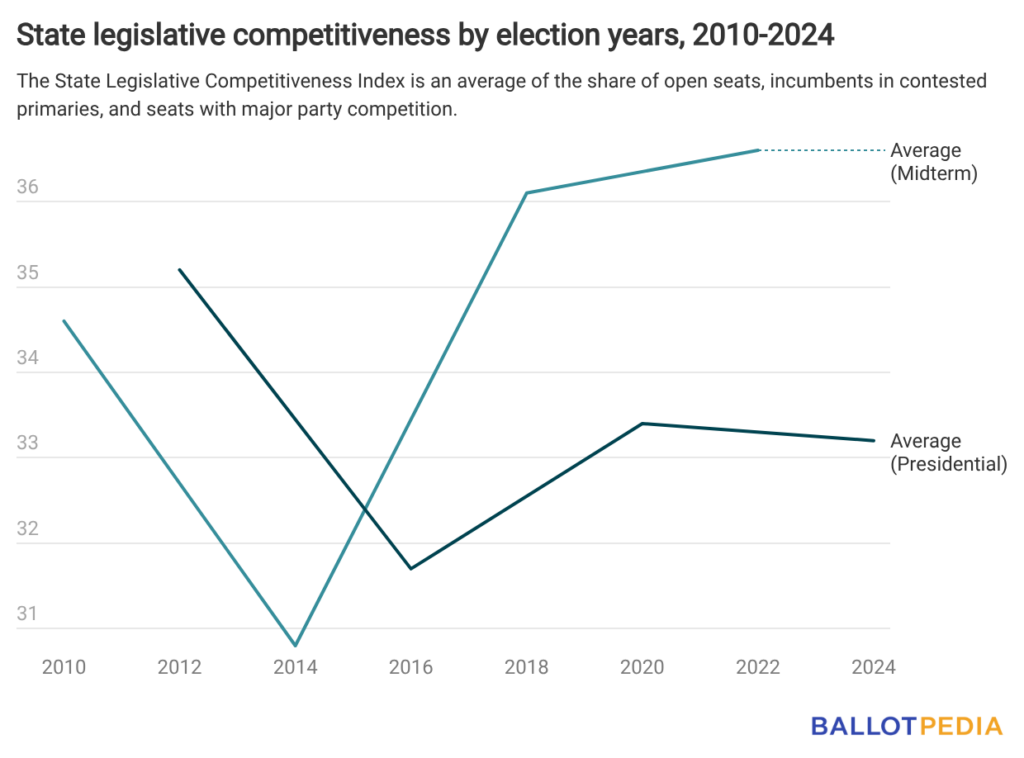
The last four midterm years saw an average of 61.6% of seats feature major party competition, 22.1% of incumbents face primary challengers, and 19.8% of seats without an incumbent running. Their average competitiveness score was 34.5.
The last four presidential years saw an average of 61.2% of seats feature major party competition, 21.3% of incumbents face primary challengers, and 17.7% of seats without an incumbent running. Their average competitiveness score was 33.4.
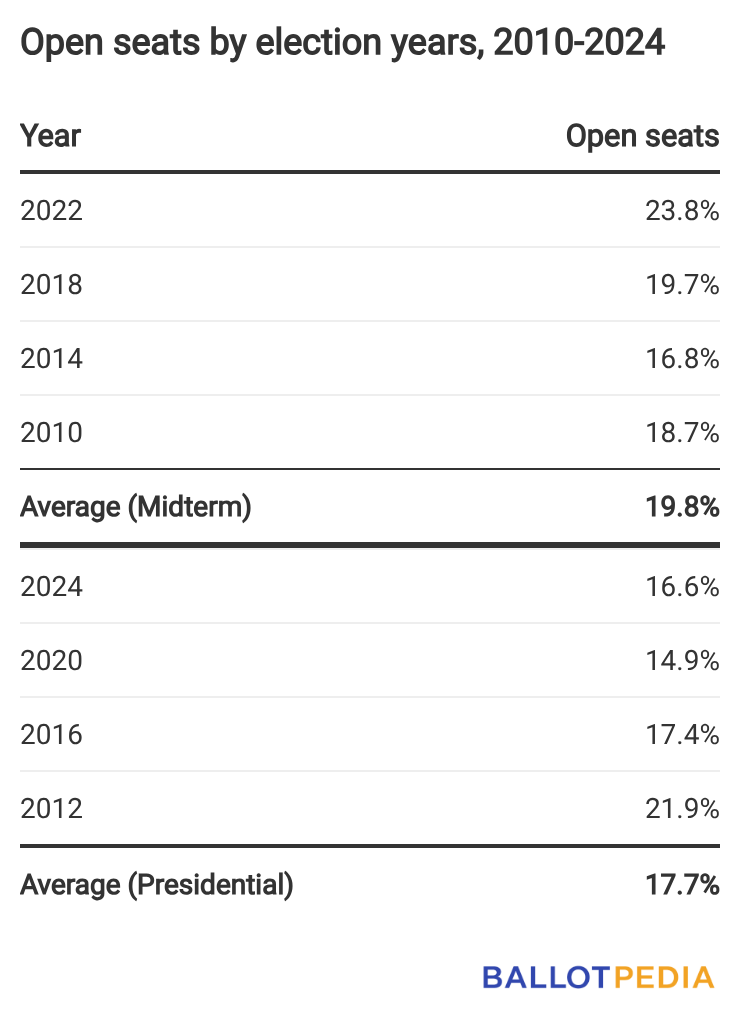
Open seats
The midterm election year with the smallest percentage of open seats (2014 at 16.8%) featured a larger share of open seats than two of the previous four presidential election years.
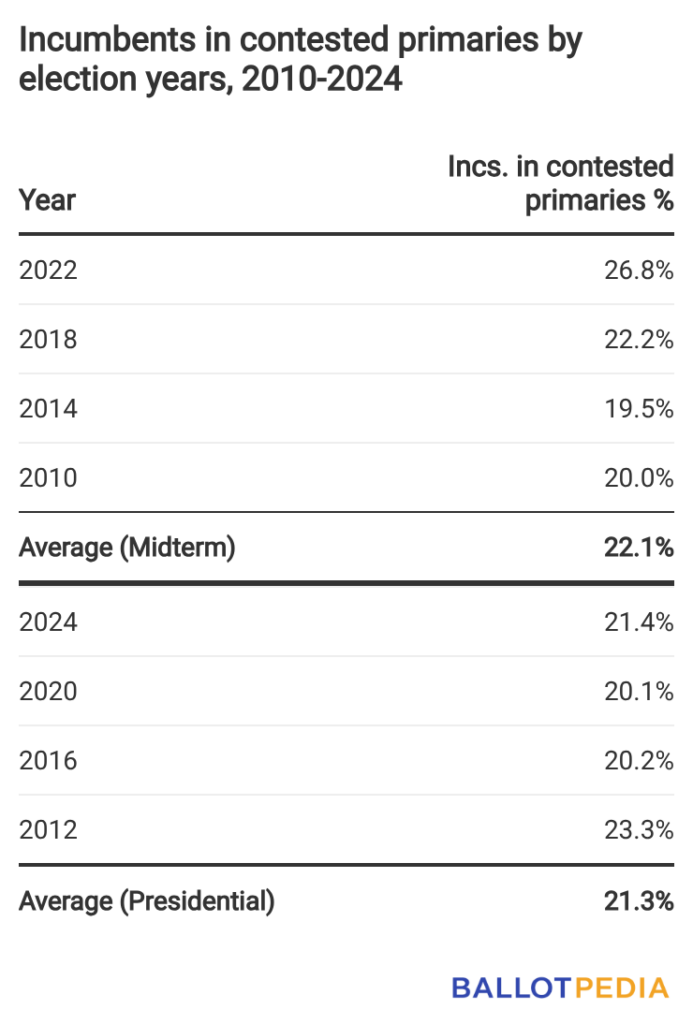
Incumbents in contested primaries
The share of incumbents in contested primaries is similar between midterm and presidential years. They each represent two of the top four scores since 2010.
Seats with major party competition
The share of seats with major party competition is also similar between midterm and presidential years. Both sets featured major party competition in above 61% of races on average.
Learn more