

In the state legislative special elections that have happened since January 2025, there was an average shift of 5.6 percentage points towards Democrats. Additionally, Democrats retained 10 percentage points more of their voter turnout from the previous regular election than Republicans.
We found these figures by comparing candidates' special election performance to their performance in the previous regularly scheduled election in each of the 96 state legislative districts where a special general election occurred.
Since January 2025, there have been 117 state legislative special elections nationwide. Ninety-six of those resulted in special general elections. The remainder of the special elections were won outright at the primary stage. Democrats won 67 of the races, and Republicans won 29.
Here’s a closer look at voter turnout retention and margin shifts in the special state legislative elections.
Voter turnout retention
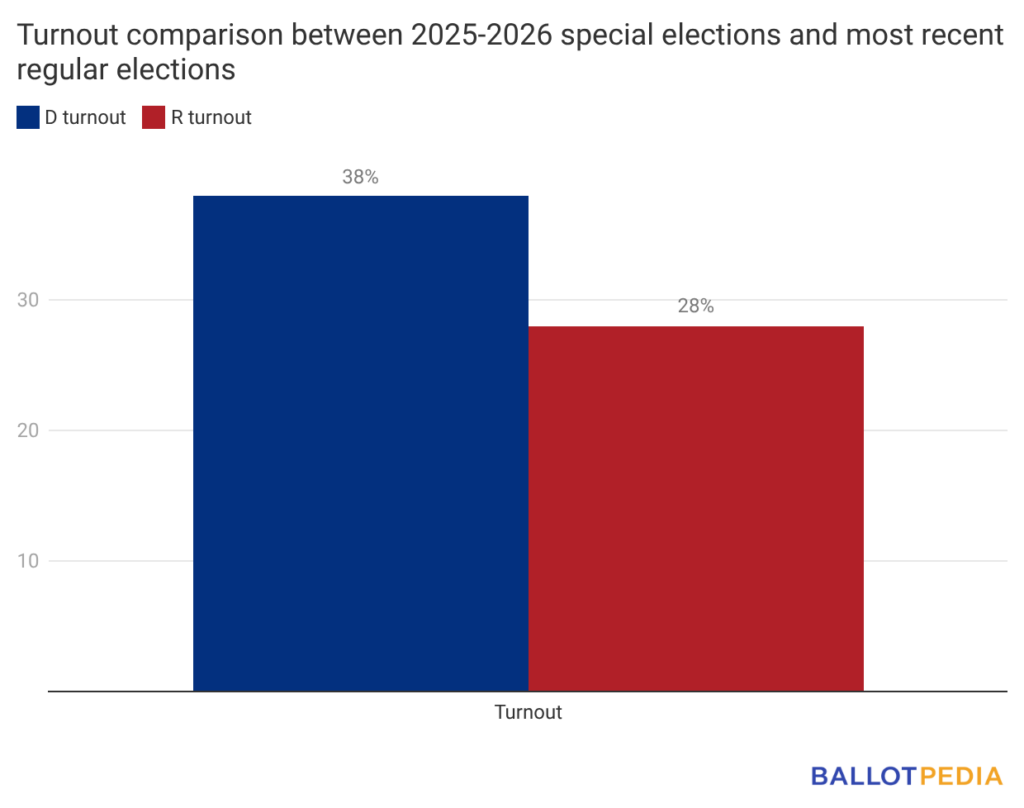
In special state legislative elections, Democrats retained 10 percentage points more of their voter turnout from the previous regular election than Republicans.
There were 76 districts where a Democrat had appeared on the special election ballot and on the previous regular general election ballot. On average in those districts, Democratic voter turnout in the special election was 38% of the party’s turnout in the previous regular general elections.
There were 72 districts where a Republican had appeared on the special election ballot and on the previous regular general election ballot. On average, Republican voter turnout in the special election was 28% of the party’s turnout in the previous regular general election.
By looking at voter turnout retention, we’re able to show each party’s ability to mobilize voters outside regular election cycles.
Margin of victory shifts
There were 50 districts where both the special election and the most recent general election had candidates from both major parties. Democrats won 37 of those special elections, and Republicans won 13. Democrats won 32 of the previous general elections in those districts, and Republicans won 18.
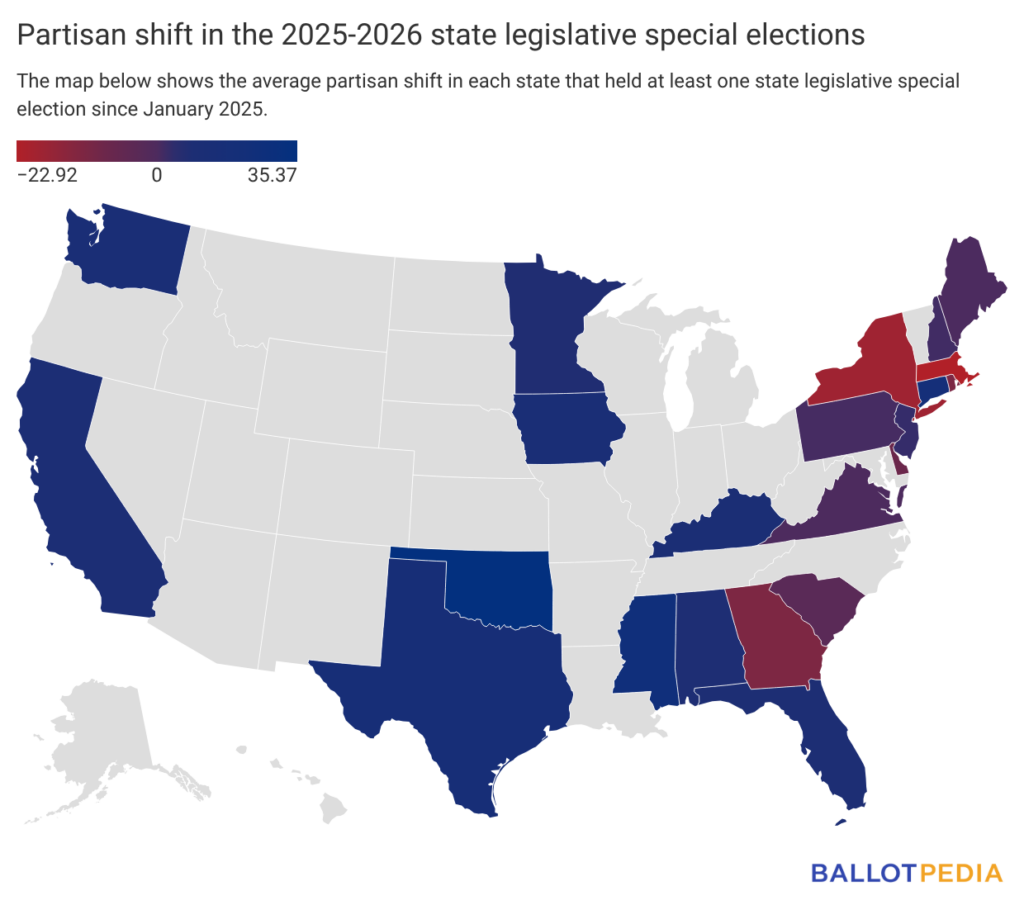
Forty of those districts shifted toward Democrats in the special election compared to the previous election, and 10 shifted toward Republicans. Overall, the average shift across all 50 districts was 5.6 percentage points toward Democrats.
The map below shows the average partisan shift in each state that had at least one state legislative special election since January 2025. The data below include all 96 special general elections.
Click here to read more about 2025 state legislative special elections, and here for 2026 state legislative special elections.