

Democrats gained control of two additional state legislative seats in a pair of early March special elections.
Alex Holladay (D) won a March 3 special election for Arkansas House District 70, winning the race by 15 percentage points in a district Republicans won by two percentage points in 2024. Bobbi Boudman (D) won a March 10 special election for New Hampshire House District Carroll 7 by four percentage points. Republicans won the 2024 election for the seat by 14 percentage points.
In the Arkansas election, Democrats retained 16 percentage points more of their voter turnout from the previous regular general election for the seat than Republicans. In New Hampshire’s Carroll 7, Democrats retained 17 percentage points more of their turnout than Republicans.
In total, Democrats have gained 10 legislative seats nationwide through special elections since January 2025. Republicans have gained no seats from special legislative elections in that timeframe.
Here’s a closer look at voter turnout retention and margin shifts in the special state legislative elections since January 2025.
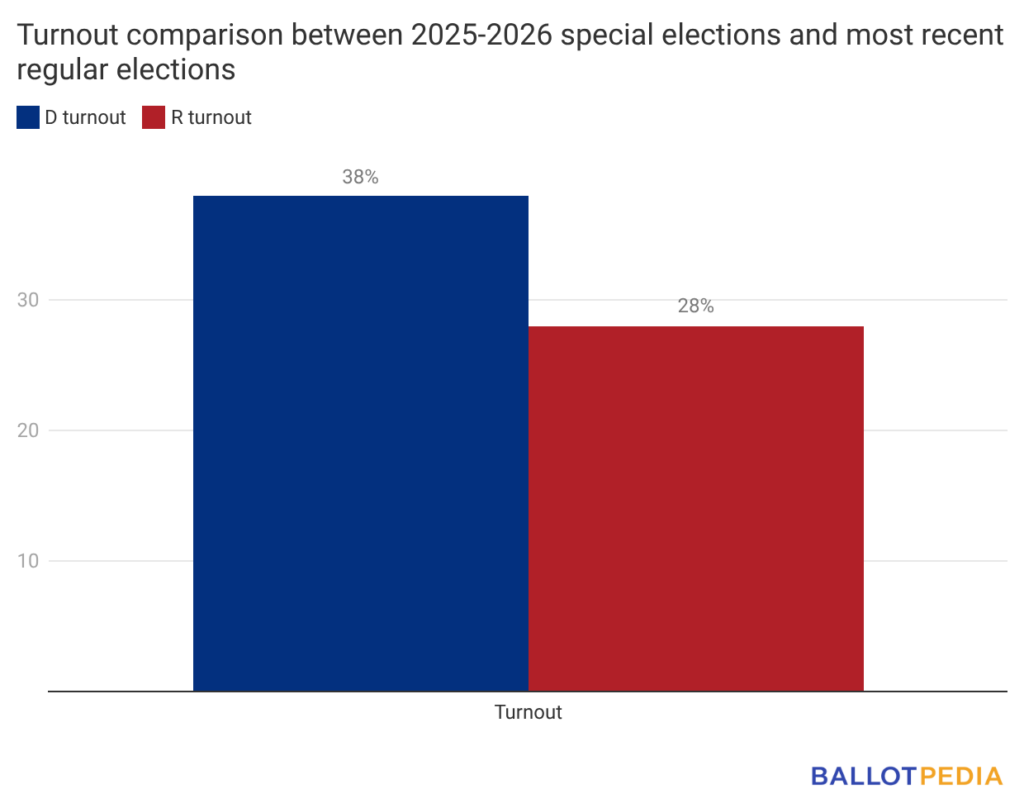
Voter turnout retention
In special state legislative elections, Democrats retained 10 percentage points more of their voter turnout from the previous regular election than Republicans.
There were 80 districts where a Democrat had appeared on the special election ballot and on the previous regular general election ballot. On average in those districts, Democratic voter turnout in the special election was 38% of the party’s turnout in the previous regular general elections.
There were 77 districts where a Republican had appeared on the special election ballot and on the previous regular general election ballot. On average, Republican voter turnout in the special election was 28% of the party’s turnout in the previous regular general election.
By looking at voter turnout retention, we’re able to show each party’s ability to mobilize voters outside regular election cycles.
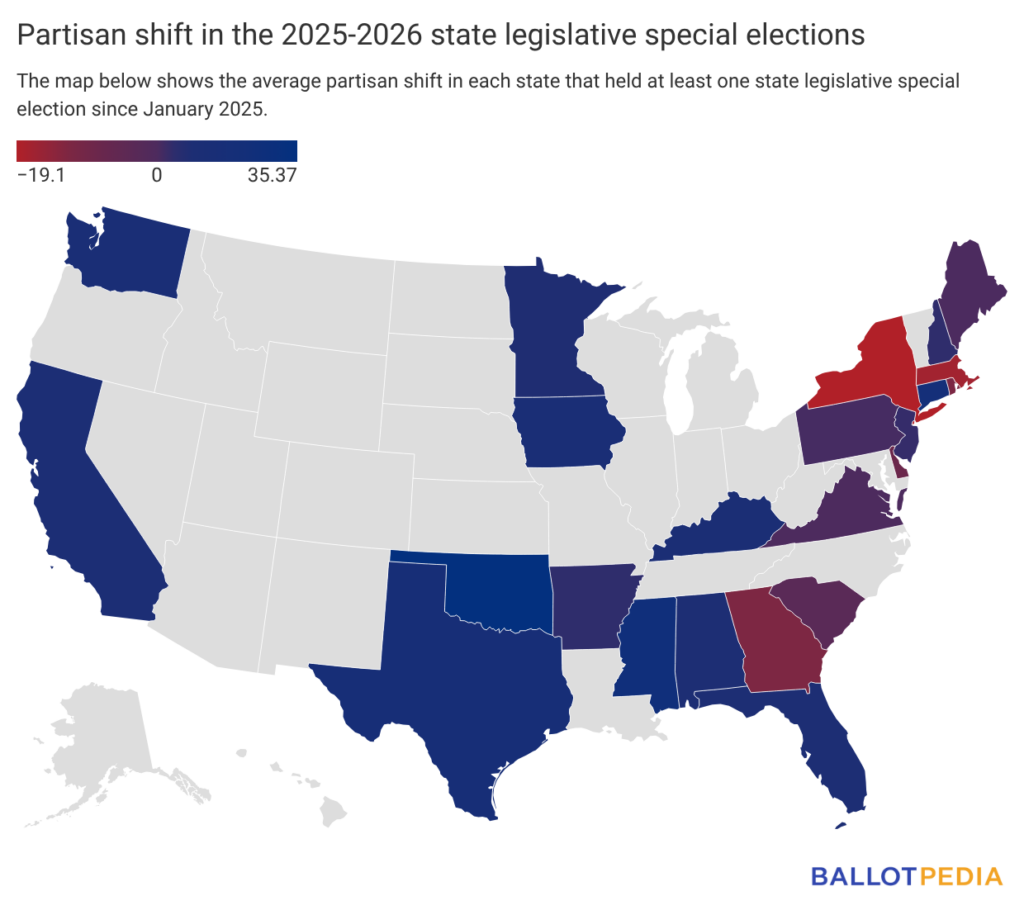
Margin of victory shifts
There were 54 districts where both the special election and the most recent general election had candidates from both major parties. Democrats won 40 of those special elections, and Republicans won 14. Democrats won 33 of the previous general elections in those districts, and Republicans won 21.
Forty-two of those districts shifted toward Democrats in the special election compared to the previous election, and 12 shifted toward Republicans. Overall, the average shift across all 54 districts was 4.7 percentage points toward Democrats.
The map below shows the average partisan shift in each state that had at least one state legislative special election since January 2025. The data below include all 100 special general elections that had been called by March 11.
Click here to read more about 2025 state legislative special elections, and here for 2026 state legislative special elections.