



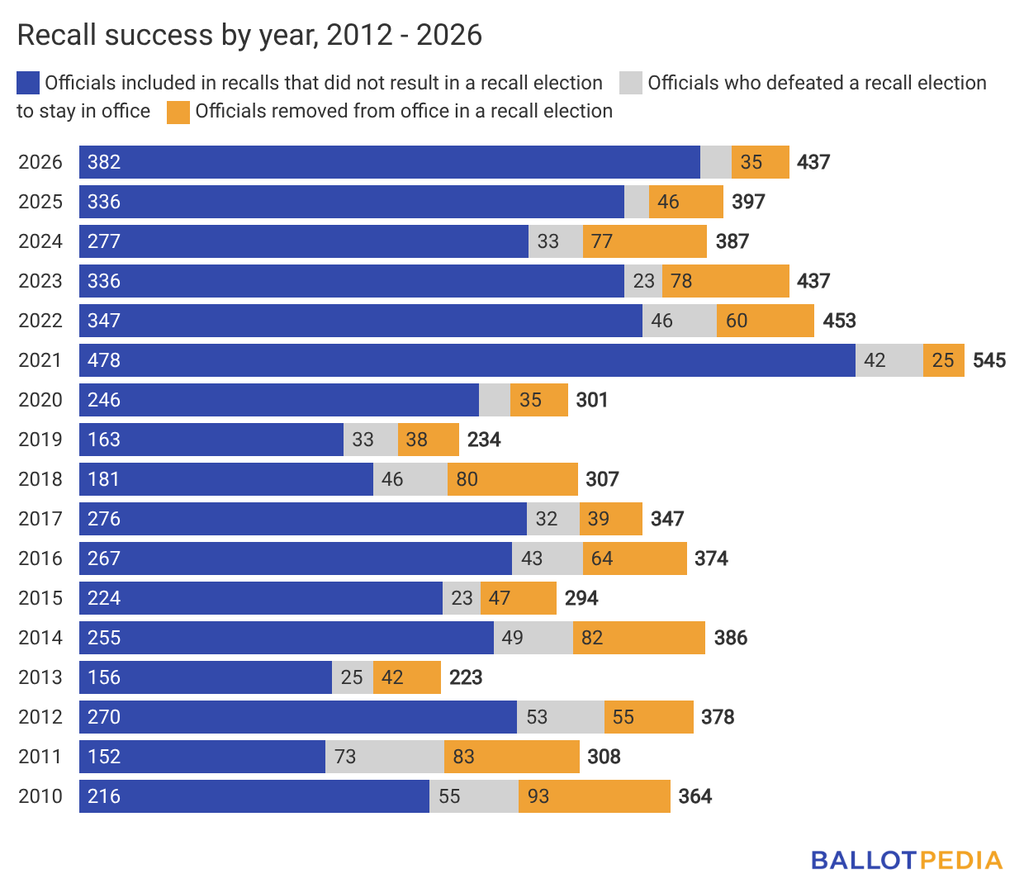
Out of the 437 elected officials named in recall efforts in 2026, 35 had been removed from office in a recall election as of Oct. 2, a success rate of 8%. That rate is lower than the 16% success rate Ballotpedia tracked from 2010 to 2025. The highest success rate occurred in 2011, when 83 of the 308 officials targeted for recall were removed from office in a recall election, a success rate of 27%. The lowest success rate occurred in 2021, when 25 of the 545 officials targeted for recall were removed from office in a recall election, a success rate of 5%.
A political recall is the process by which citizens can remove elected officials from office before their term is completed. This process typically includes the circulation of petitions by recall organizers, the evaluation of signatures by election officials, and a public vote if the petitions are deemed to have a sufficient number of valid signatures. The details of the recall process vary from state to state. Click here to learn about the laws governing recalls in each state.
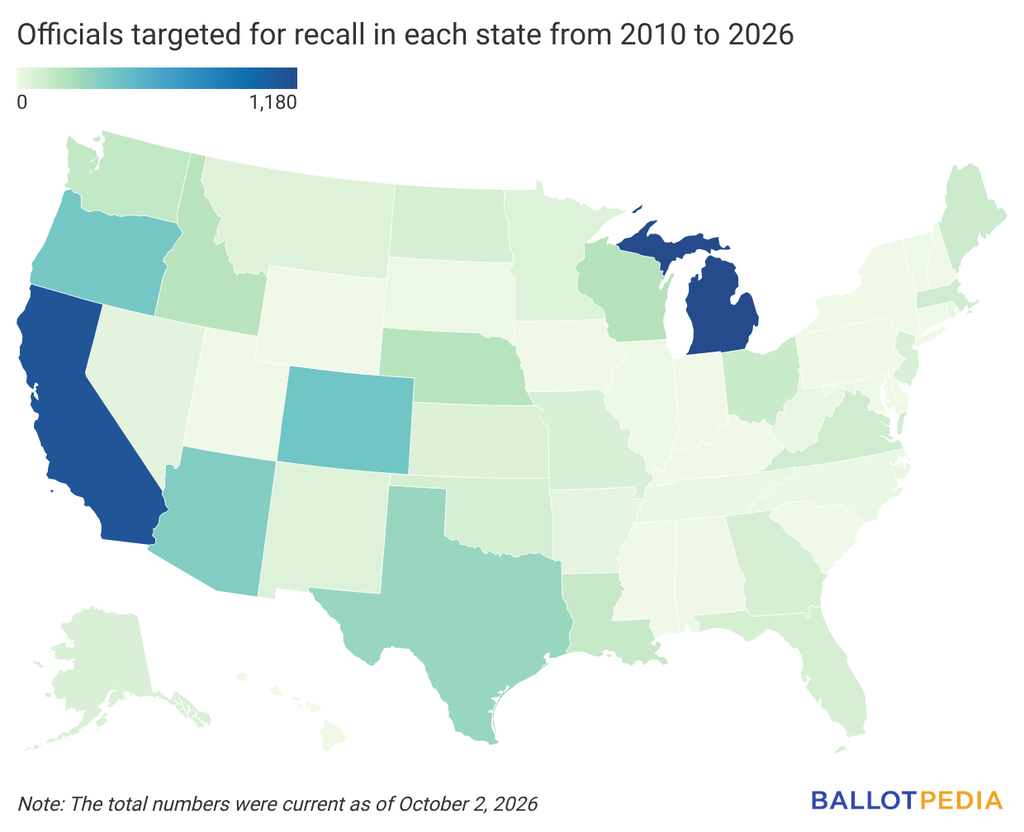
When looking at recalls by state, Michigan saw the highest number of officials included in recall efforts since 2010 with 1,180. Those officials account for 19% of all recalls Ballotpedia had tracked as of Oct. 2. California had the second-highest with 1,115 (18%), and Colorado was third-highest with 413 (7%).
The map below shows the total number of officials targeted for recall in each state from 2010 to Oct. 2, 2026. Ballotpedia did not track any recall efforts in the states shown in gray.
Among all office types in 2026, city council members had the most recall petitions filed against them with 201 as of Oct. 2. Mayors came in second with 67, and school board members were third with 65.
From 2010 to 2025, city council members had the most recall petitions filed against them, except in 2021 when school board members had the most. School board members had the second-most recall petitions filed against them in every year except two: 2021, when they had the most, and 2017, when they ranked third, behind city council members and mayors.
Additional reading: