

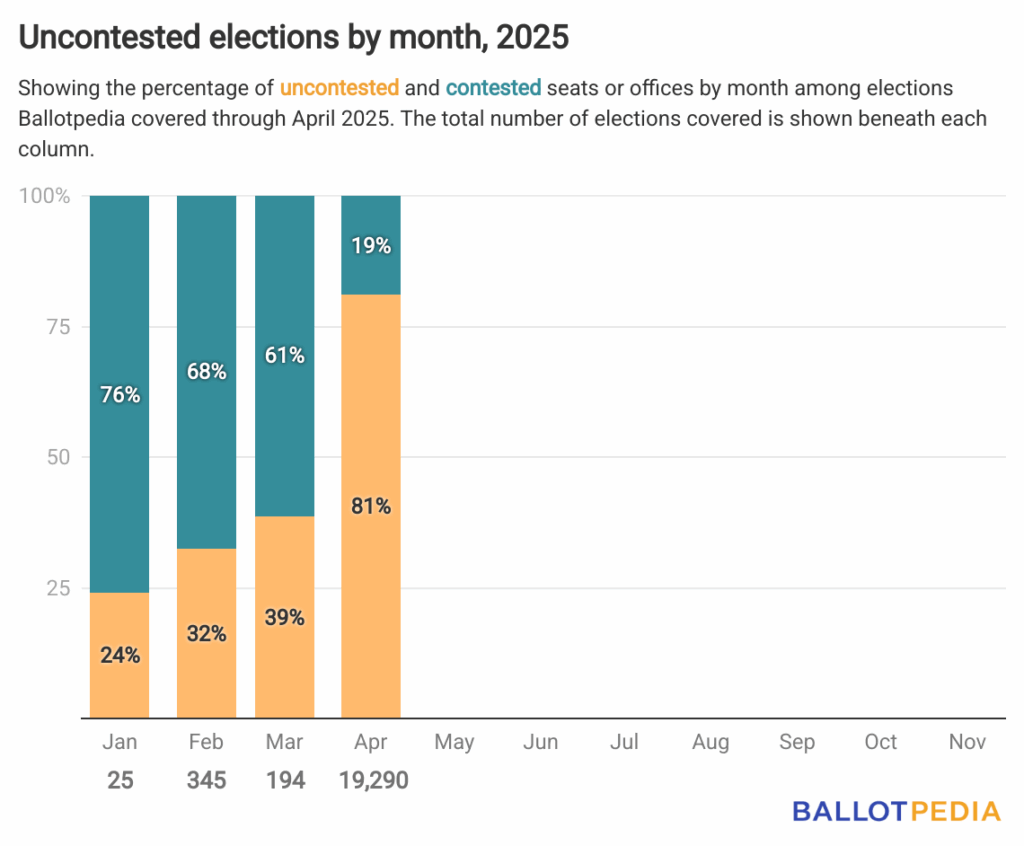
Throughout April, Ballotpedia covered 19,290 elections across 21 states, 81% of which were uncontested.
That’s up from March, when 39% of the 194 covered were uncontested.
Ballotpedia defines an uncontested election as one where the number of candidates running is less than or equal to the number of seats up for election. This analysis does not account for write-in candidates.
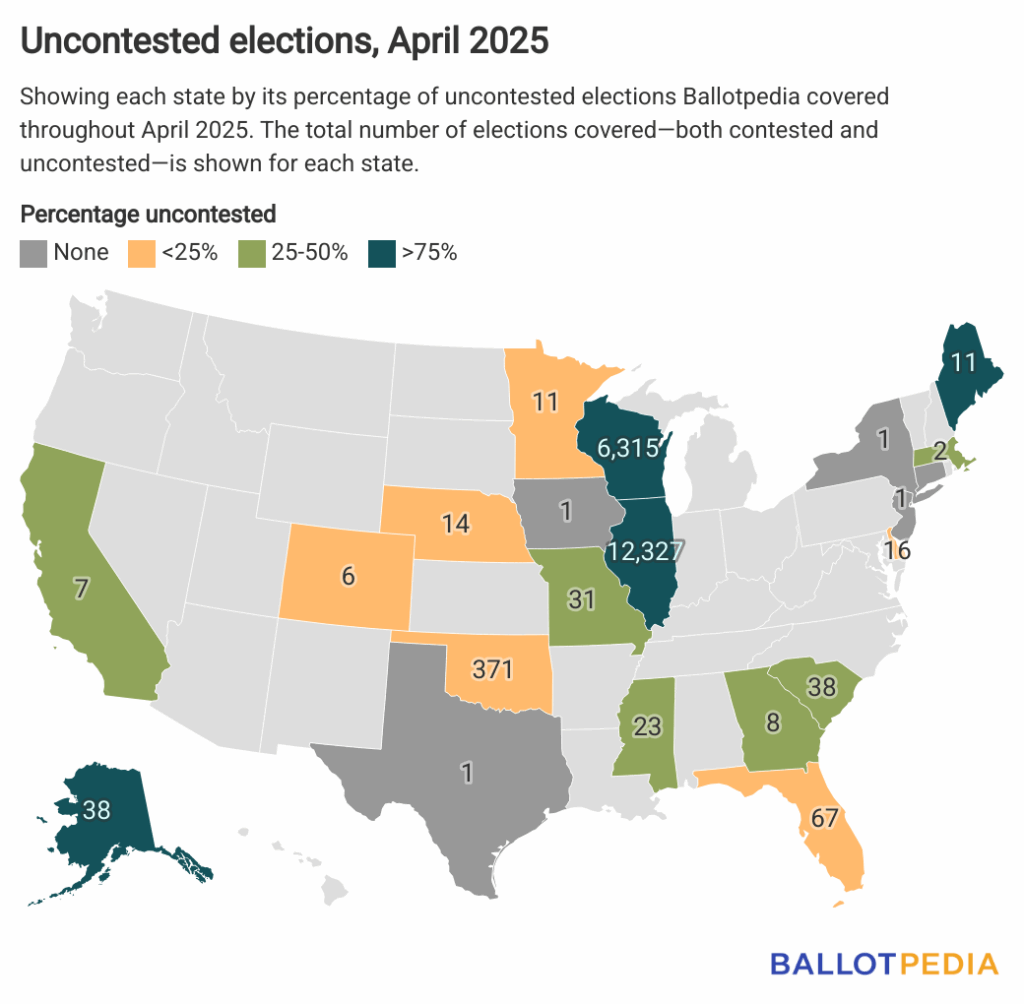
Illinois and Wisconsin had the largest number of elections covered, with 12,327 and 6,315 races, respectively. Both states reported the highest percentages of uncontested elections—83% in each case. Among other states with larger sample sizes, Alaska (76%) and Maine (82%) also recorded high shares of uncontested races.
Oklahoma had the lowest rate of uncontested elections at 6%, though the actual number is likely higher. Oklahoma cancels uncontested elections, and canceled elections are not included in this analysis. Florida followed with 7%, and Colorado with 17%.
Ballotpedia recorded no uncontested elections in Connecticut, Iowa, New Jersey, New York, and Texas. However, each state included only a single race in the sample.
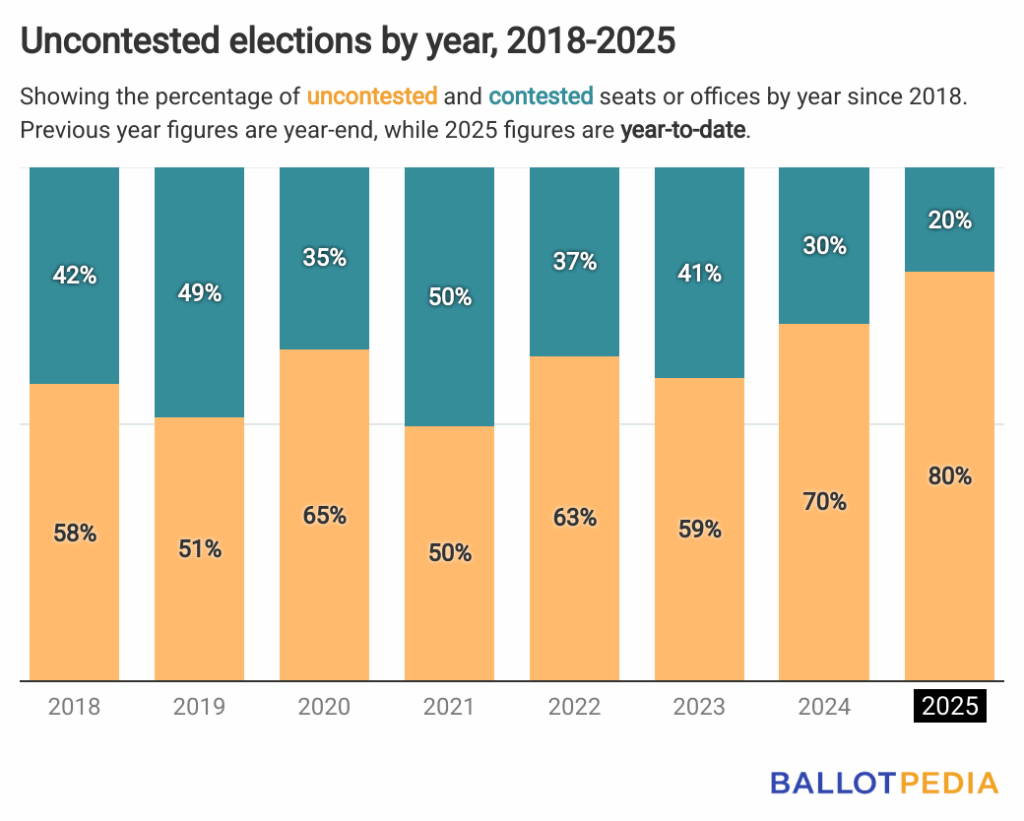
April’s rate of uncontested elections was greater than the 64% average rate identified between 2018 and 2024.
It also raises the year-to-date rate of uncontested elections to 80%.
For comparison, since 2018, each year has had more uncontested than contested elections, except for one, in 2021, when 50.4% of the elections Ballotpedia covered were contested.
Click on the link below to learn more about uncontested elections nationwide last month and in all previous months through 2025.