



In 2026, Ballotpedia surveyed school board members to document their experiences serving on school boards and explore differences between serving on school boards in urban, suburban, and rural districts.
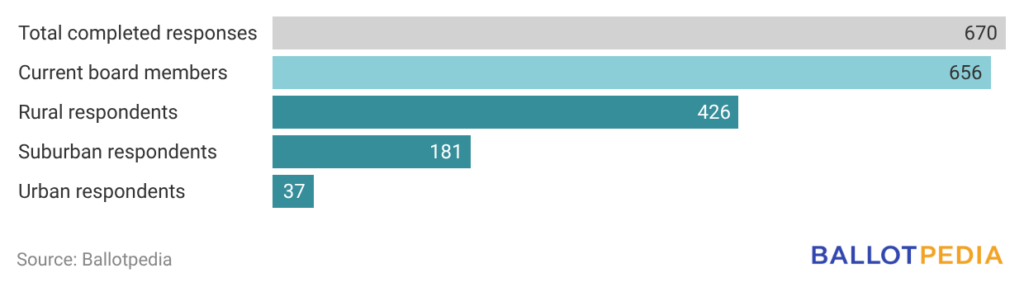
The survey included Hall Pass subscribers and members of the National School Board Association (NSBA) rural group, and totaled 670 respondents. Of these, 656 were serving on school boards at the time of the survey; 426 served in rural districts, 181 in suburban districts, and 37 in urban districts. Because the survey oversampled rural school board members, its key findings focus on their experiences.
The survey found that:
- Rural board members were more likely to report difficulties related to transportation than other boards, and felt that they faced other challenges specific to their district type such as an "everyone knows everyone" dynamic.
- Community engagement in rural districts takes a different form, with fewer weekly interactions with constituents, but media attendance at board meetings was similar across district types.
- Rural board members reported lower rates of threats than suburban and urban members.
- Despite reporting that they experienced challenges that other school board members do not, rural school board member retention is strong.
Overview of the survey
Ballotpedia surveyed 670 Hall Pass subscribers and National School Board Association (NSBA) rural group members from March 24–26, 2026. Six hundred and forty responses were from Hall Pass readers, and 30 were from NSBA rural group members.
Here's a breakdown of respondents by geographical area. Respondents were asked to classify the district they served as either rural, suburban, or urban.
Unique challenges for rural school districts
Sixty-one percent of rural respondents said they faced challenges that peers in other district types didn’t, compared to 41% of suburban and 35% of urban respondents.
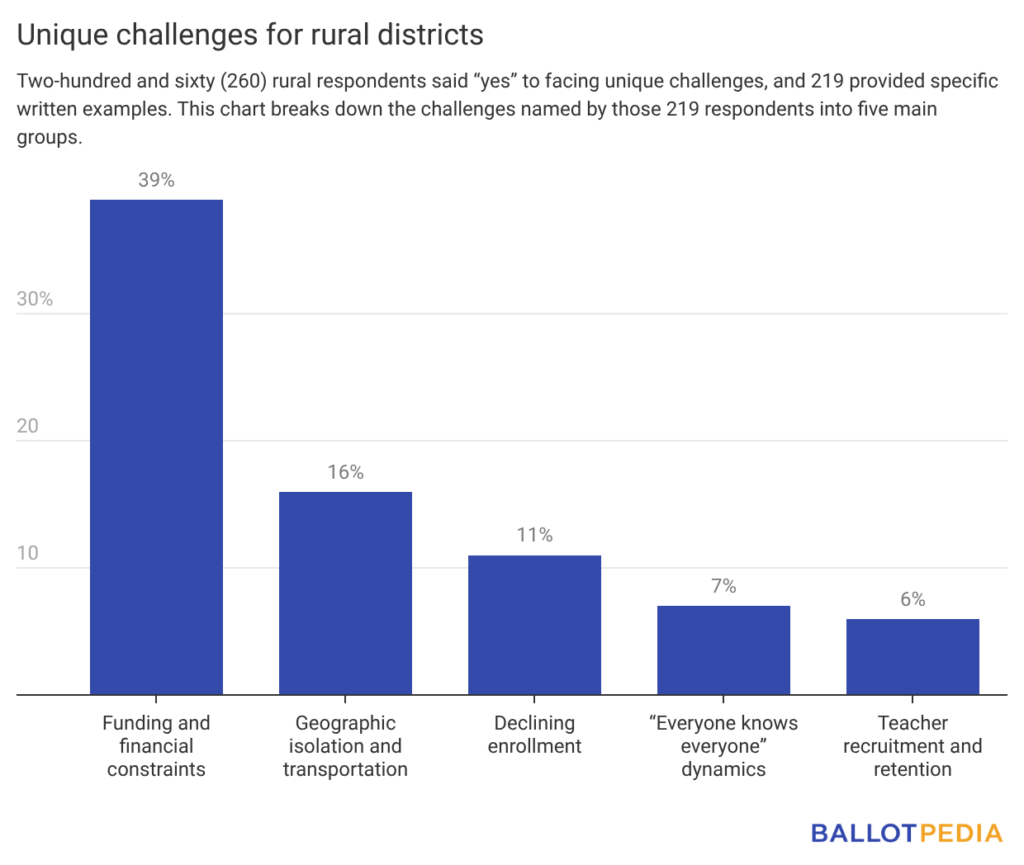
Respondents said that these themes overlapped. Twelve respondents cited both enrollment decline and funding in the same response, and 7 mentioned funding alongside teacher recruitment.
Community engagement in rural districts
The survey asked respondents about different types of community engagement, including:
- Community member school board meeting attendance. Fifty-two percent of rural respondents, 32% of suburban respondents, and 22% of urban respondents said their most well-attended meeting drew fewer than 15 people.
- How often school board members heard from community members. Thirty-five percent of rural respondents heard from parents or community members a few times a month, compared to 43% of suburban respondents and 18% of urban respondents. Thirteen percent of rural respondents heard from them weekly, compared to 22% of suburban respondents and 34% of urban respondents.
- How school board members communicated with the community. Respondents said they communicated with the community through multiple channels. Rural school board members were less likely to use a direct website or social media, but were more likely to post information in a public location.
- Media coverage of school board meetings. Twenty-four percent of rural respondents said local media either didn’t exist or never attended their meetings. Combined with the 21% who said media rarely attended, 45% of rural boards operated with minimal media presence. Forty-six percent of suburban and 43% of urban respondents said they operated with minimal media presence.
Rural respondents' community conflict and climate
Nineteen percent of rural, 28% of suburban, and 29% of urban respondents reported being personally threatened. Princeton's Bridging Divides Initiative reported the national benchmark — 36% of school board members reported insults and 20% reported harassment — without rural, suburban, and urban segmentation. The nature of threats described by rural respondents tended to be interpersonal rather than organized. Ballotpedia's survey found that in each geographic designation (rural, suburban, and urban), the portion of respondents who were or felt threatened was lower than the 36% national benchmark.
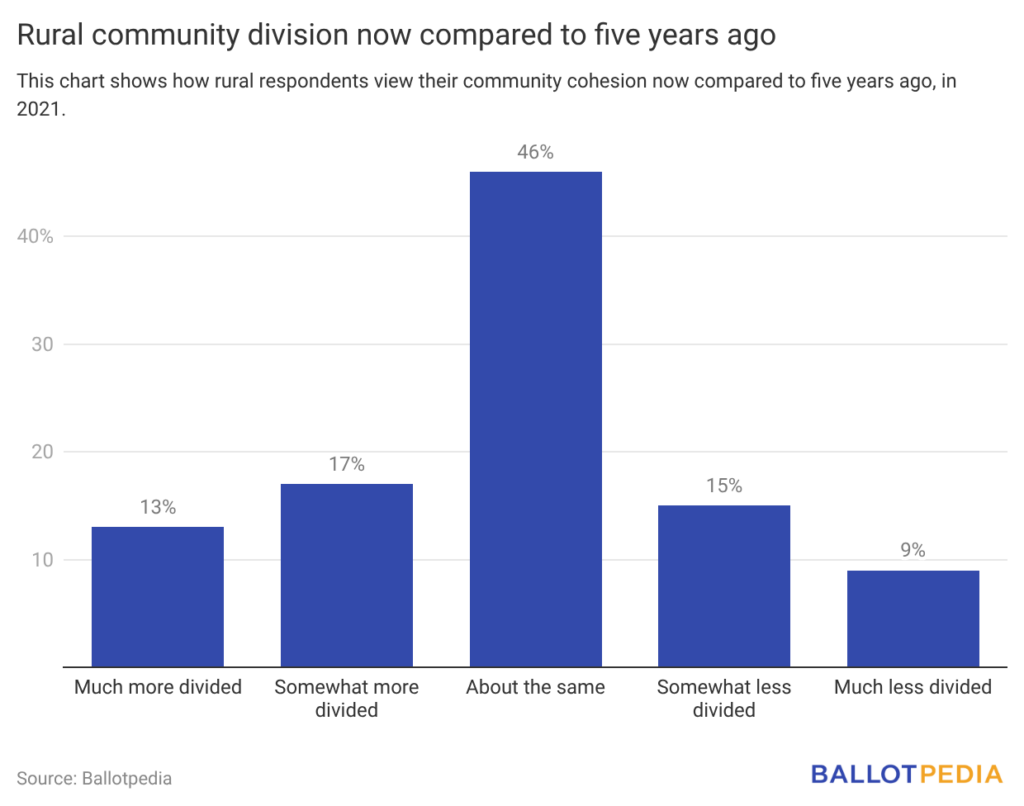
Thirty percent of rural respondents said their community was more divided than it was 5 years ago, 24% said it was less, and 46% said it was about the same. Thirty-six percent of suburban respondents said their community was more divided, 30% said it was less, and 38% said it was about the same as it was five years ago. Eighteen percent of urban respondents said their community was more divided, 34% said it was less, and 47% said it was about the same as it was five years ago.
Rural respondent retention as school board members
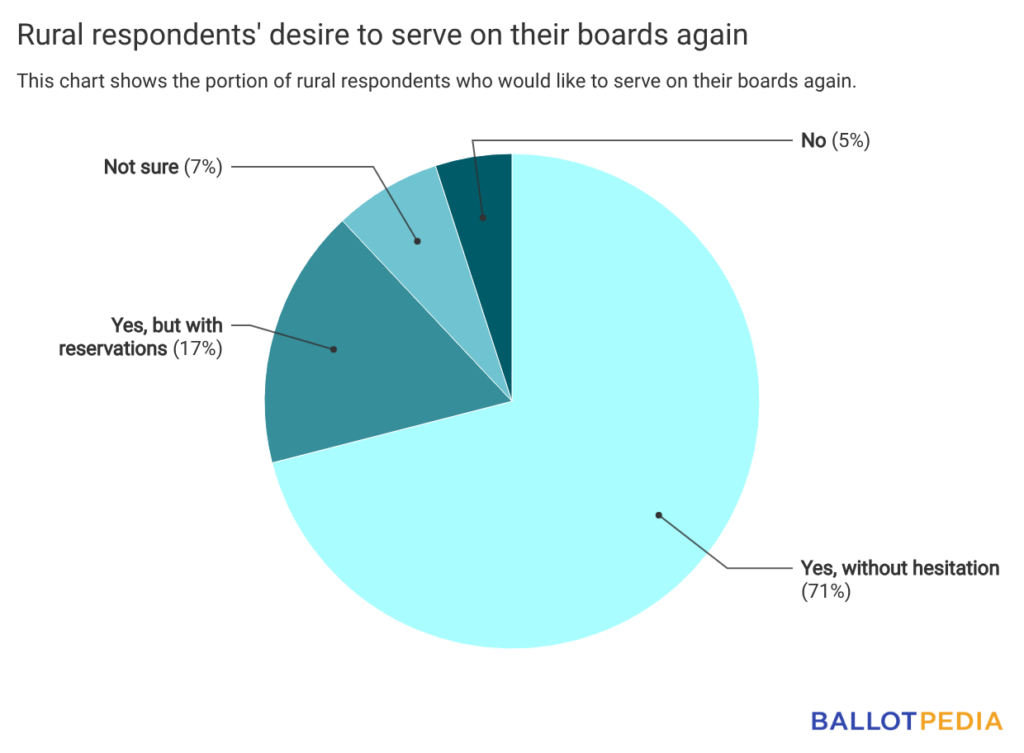
Eighty-eight percent of rural board respondents would choose to serve again, compared to 94% of suburban and 87% of urban respondents. Rural respondents tended to report reservations that related to board dynamics and political frustration, not the work itself.
To view all the results and a detailed breakdown of the data, click here.