


Welcome to the Friday, Nov. 13, 2026, Brew.
By: Briana Ryan
Here’s what’s in store for you as you start your day:
- How election results are made official
- The side that raised more money won or is leading in 64% of the 2026 ballot measures with campaign contributions
- Thirty-four states complete unofficial results reporting by Nov. 10
How election results are made official
Today, we're sharing the 10th installment in our project marking America's 250th anniversary: The Blueprints of Democracy.
Many voters assume that when 100% of the precincts have reported their election returns, an election is over. While it’s true that in the overwhelming majority of elections we know who won and who lost once that 100% reporting figure is reached, the election administration process still has several more steps to complete before the returns are official.
How long after an election can votes arrive and still be counted?
Ballots are counted on election night, but the tabulation process continues in the following days. Fourteen states, for instance, count absentee and mail-in ballots that have been postmarked by Election Day if they arrive within a set time period after the election. Many states allow ballots from members of the military and voters living abroad to be counted if they arrive within a certain number of days following the election. And 24 states allow voters to cure defects with their absentee or mail-in ballots following Election Day. In Oregon, voters have up to 21 days to do this.
How are election results canvassed and certified?
In most states, a county or local canvass to review and approve the results occurs within a legally established number of days following the election. This could include tabulating late-arriving ballots, deciding whether provisional ballots should be counted, and ensuring the vote count is accurate. Once approved, those results are then sent to the state. A group of state officials then conducts the state canvass and officially certifies the results. After the canvassing process is complete, state or local officials will then issue certificates of election for the winning candidates. In some states, state officials may pause the process if a recount is underway or if a county or municipality has not submitted its election results.
This process can look different depending on the state. Rhode Island, for example, does not conduct a local canvass. In eight states, the canvassing deadline and process vary according to the office up for election. In Michigan, a close presidential election will trigger an expedited canvassing and certification process.
How quickly this process plays out depends on the state. In Florida, election officials are legally required to count and deliver results quickly after the polls close. Oklahoma and South Dakota are legally required to canvass and certify results within one week of the election. States like California, which get a higher percentage of their ballots after Election Day, may take longer to fully count, report, and certify their results.
Click here to see our past installments of our Blueprints of Democracy series.
The side that raised more money won or is leading in 64% of the 2026 ballot measures with campaign contributions
Campaigns supporting and opposing statewide ballot measures in 2026 raised $1.27 billion as of Nov. 10. Among the 97 measures that reported raising money, the side that raised more won or is leading in 62 (64%). The side that raised less won or is leading in 35 (36%).
That’s below the overall win-loss rate from 2016 to 2025. Among 525 decided measures with campaign contributions, the side that raised more won 385, or 73%. In the even-numbered years from 2016 to 2024, that rate ranged from 67% (2024) to 82% (2022).
Our analysis covers 164 statewide measures with results, including five that remained uncalled as of Nov. 10. Uncalled measures are counted according to their current leads. Of the 164 measures, 97 had reported contributions on at least one side, and 67 did not.
Of the 62 measures for which the side that raised more won or is leading, 43 (69%) were supporters and 19 (31%) were opponents. Of the 35 for which the side that raised less won or is leading, 25 (71%) were opponents and 10 (29%) were supporters.
Among the 43 measures for which only one side reported contributions, the side that raised money won or is leading in 30 (70%). Among the 54 measures with contributions on both sides, the better-funded side won or is leading in 32 (59%) and lost in 22 (41%).
Of the 10 measures that raised the most money, the side that raised more won or is leading in seven and lost in three.
The side that raised more won:
- California Proposition 40: Opponents raised $140.5 million to supporters' $33.2 million. Voters defeated the measure 53.2% to 46.8%.
- Virginia Redistricting Amendment (April): Supporters raised $67.6 million to opponents' $35.4 million. Voters approved the measure 51.7% to 48.3%. The Virginia Supreme Court later declared the measure's results void.
- California Proposition 3: Supporters raised $74.9 million to opponents' $5,500. Voters approved the measure 60.4% to 39.6%.
- California Proposition 37: Supporters raised $73.8 million, while opponents reported no contributions. Voters approved the measure 62.2% to 37.8%.
- California Proposition 38: Supporters raised $71.2 million to opponents' approximately $10,000. Voters approved the measure 54.2% to 45.8%.
- California Proposition 44: Opponents raised $38.6 million to supporters' $16.9 million. Voters defeated the measure 80.9% to 19.1%.
The side that raised more is leading, but the race has not been called:
- California Proposition 42: Supporters raised $138.5 million to opponents' $34.2 million. Currently, the “Yes” vote is leading 51.6% to 48.4%.
The side that raised more money, but lost:
- California Proposition 41: Supporters raised $68.8 million to opponents' $34.2 million. Voters defeated the measure 54.6% to 45.4%.
- California Proposition 45: Supporters raised $44.1 million to opponents' $30.4 million. Voters defeated the measure 55.9% to 44.1%.
- California Proposition 39: Supporters raised $39.5 million to opponents' $33.6 million. Voters defeated the measure 60.4% to 39.6%.
Click here to read about campaign finance in this year’s statewide ballot measure elections.
Thirty-four states complete unofficial results reporting by Nov. 10
Above, we explored the steps that go into making election results official. Just as the procedures and timelines for canvassing and certification vary by state, a variety of factors affect how quickly states finish reporting their unofficial results after an election. This year, 34 states finished their unofficial reporting of Nov. 3 election results within one week of Election Day.
Unofficial results include all Election Day, early voting, and regular absentee/mail-in ballots, but do not necessarily include provisional ballots, cured ballots, or ballots from overseas or military voters. Local and state governments finalize official election results during the canvassing and certification process outlined above.
The following map shows which states finished their unofficial reporting as of 5 p.m. EST on Nov. 10.
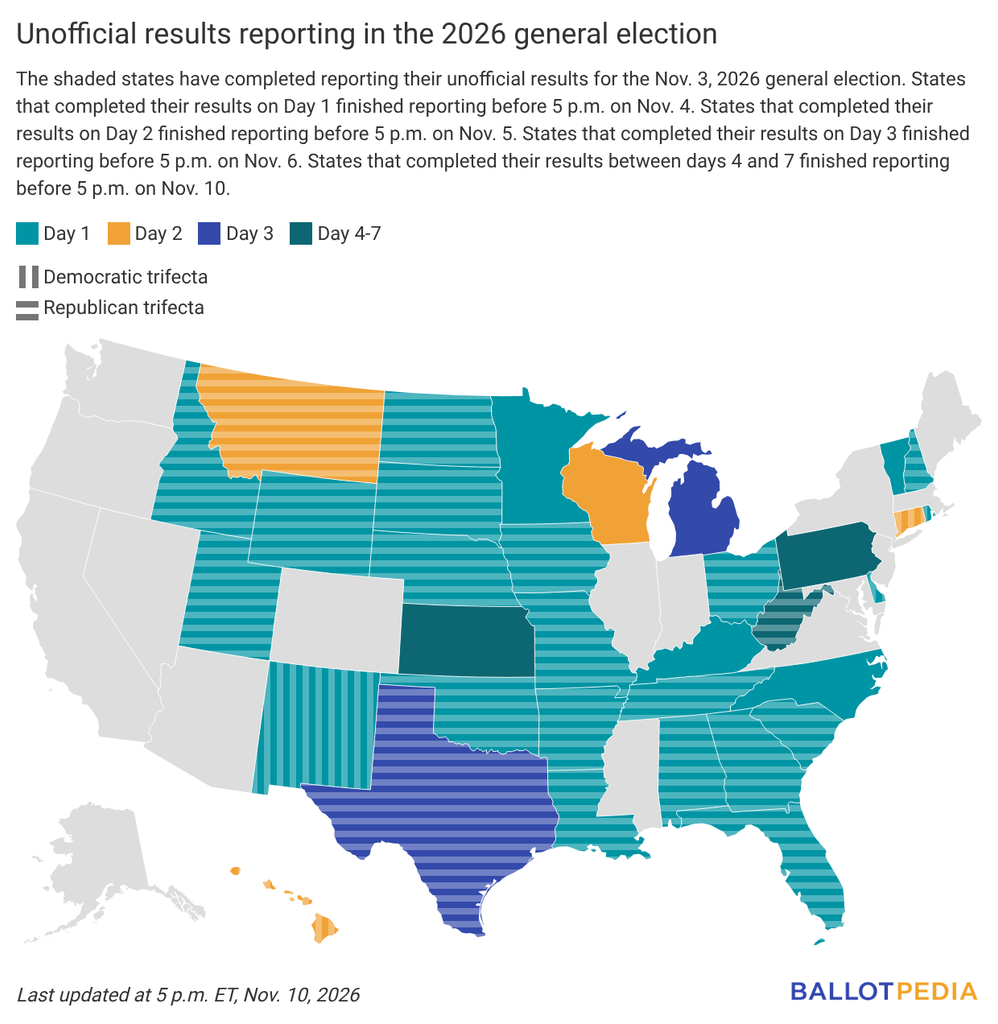
Twenty-five states finished their unofficial reporting of the Nov. 3 election results by 5 p.m. EST on Nov. 4. Four states finished reporting their results by 5 p.m. EST on Nov. 5. Two states reported their results by 5 p.m. EST on Nov. 6, and three more finished by 5 p.m. EST on Nov. 9.
The nine states that reported their results between Nov. 5 and Nov. 10 are Connecticut, Hawaii, Kansas, Michigan, Montana, Pennsylvania, Texas, West Virginia, and Wisconsin. Before the election, two of those states had Democratic trifectas, three had Republican trifectas, and four had divided governments.
Sixteen states had yet to finish reporting their unofficial results. The states that were closest to completion were Maryland and Massachusetts, which had completed their results reporting except for absentee/mail-in ballots that arrived after Election Day. The state furthest from completion was California, with 85% of its results reported.
In some states, unofficial election results are usually reported quickly, with nearly full results available on Election Day or shortly after. In other states, it may take election officials weeks to deliver the same results.
Differences in election administration methods, policies, and priorities across states are responsible for the various reporting times. This reflects the decentralized nature of election administration in the U.S.
Factors that can affect the speed of results reporting include:
- The percentage of voters participating in absentee/mail-in and early voting
- Absentee/mail-in ballot processing and counting rules and timelines
- Policies related to tabulation and reporting
- Vote counting resources
Ballotpedia will publish an analysis of results reporting in the 2026 primary and general elections after all states finalize their 2026 general election results.
Click here for more information on unofficial results reporting in this year’s election.