Tag: uncontested elections
-
70% of last June’s elections were uncontested

Throughout June, Ballotpedia covered 900 elections in 20 states, 70% of which were uncontested. That’s up from May, when 43% of the 2,892 covered were uncontested. Ballotpedia defines an uncontested election as one where the number of candidates running is less than or equal to the number of seats up for election. This analysis does…
-
43% of last May’s elections were uncontested
Throughout May, Ballotpedia covered 2,891 elections in 24 states, 43% of which were uncontested. That’s down from April, when 81% of the 19,290 covered were uncontested. Ballotpedia defines an uncontested election as one where the number of candidates running is less than or equal to the number of seats up for election. This analysis does…
-
81% of last April’s elections were uncontested

Throughout April, Ballotpedia covered 19,290 elections across 21 states, 81% of which were uncontested. That’s up from March, when 39% of the 194 covered were uncontested. Ballotpedia defines an uncontested election as one where the number of candidates running is less than or equal to the number of seats up for election. This analysis does…
-
39% of last March’s elections were uncontested
Throughout March, Ballotpedia covered 194 elections in 22 states, 39% of which were uncontested. That’s up from February when 32% of the 345 covered were uncontested. Ballotpedia defines an uncontested election as one where the number of candidates running is less than or equal to the number of seats up for election. This analysis does…
-
32% of last February’s elections were uncontested

Throughout February, Ballotpedia covered 346 elections in 15 states, 32% of which were uncontested. The rate has increased since January when 24% of the 25 covered were uncontested. Ballotpedia defines an uncontested election as one where the number of candidates running is less than or equal to the number of seats up for election. This…
-
24% of last January’s elections were uncontested
Throughout January, Ballotpedia covered 25 elections in seven states, 24% of which were uncontested. That’s down from December when 44% of the 123 covered elections were uncontested but comparable to last January when 30% of the 23 covered elections were uncontested Ballotpedia defines an uncontested election as one where the number of candidates running is…
-
44% of December’s elections were uncontested
Throughout December, Ballotpedia covered 123 elections in 13 states, 44% of which were uncontested. That’s down from November, when 65% of the 40,710 covered were uncontested. Ballotpedia defines an uncontested election as one where the number of candidates running is less than or equal to the number of seats up for election. This analysis does…
-
63% of elections in Wyoming are uncontested
Of 505 regular elections in Wyoming—320 (63%) are uncontested. An uncontested election is one where the number of candidates on the ballot is less than or equal to the number of seats up for election. Of the 26 states where Ballotpedia is covering every election on Nov. 5, Wyoming has the 13th highest rate of…
-
73% of elections in Wisconsin are uncontested
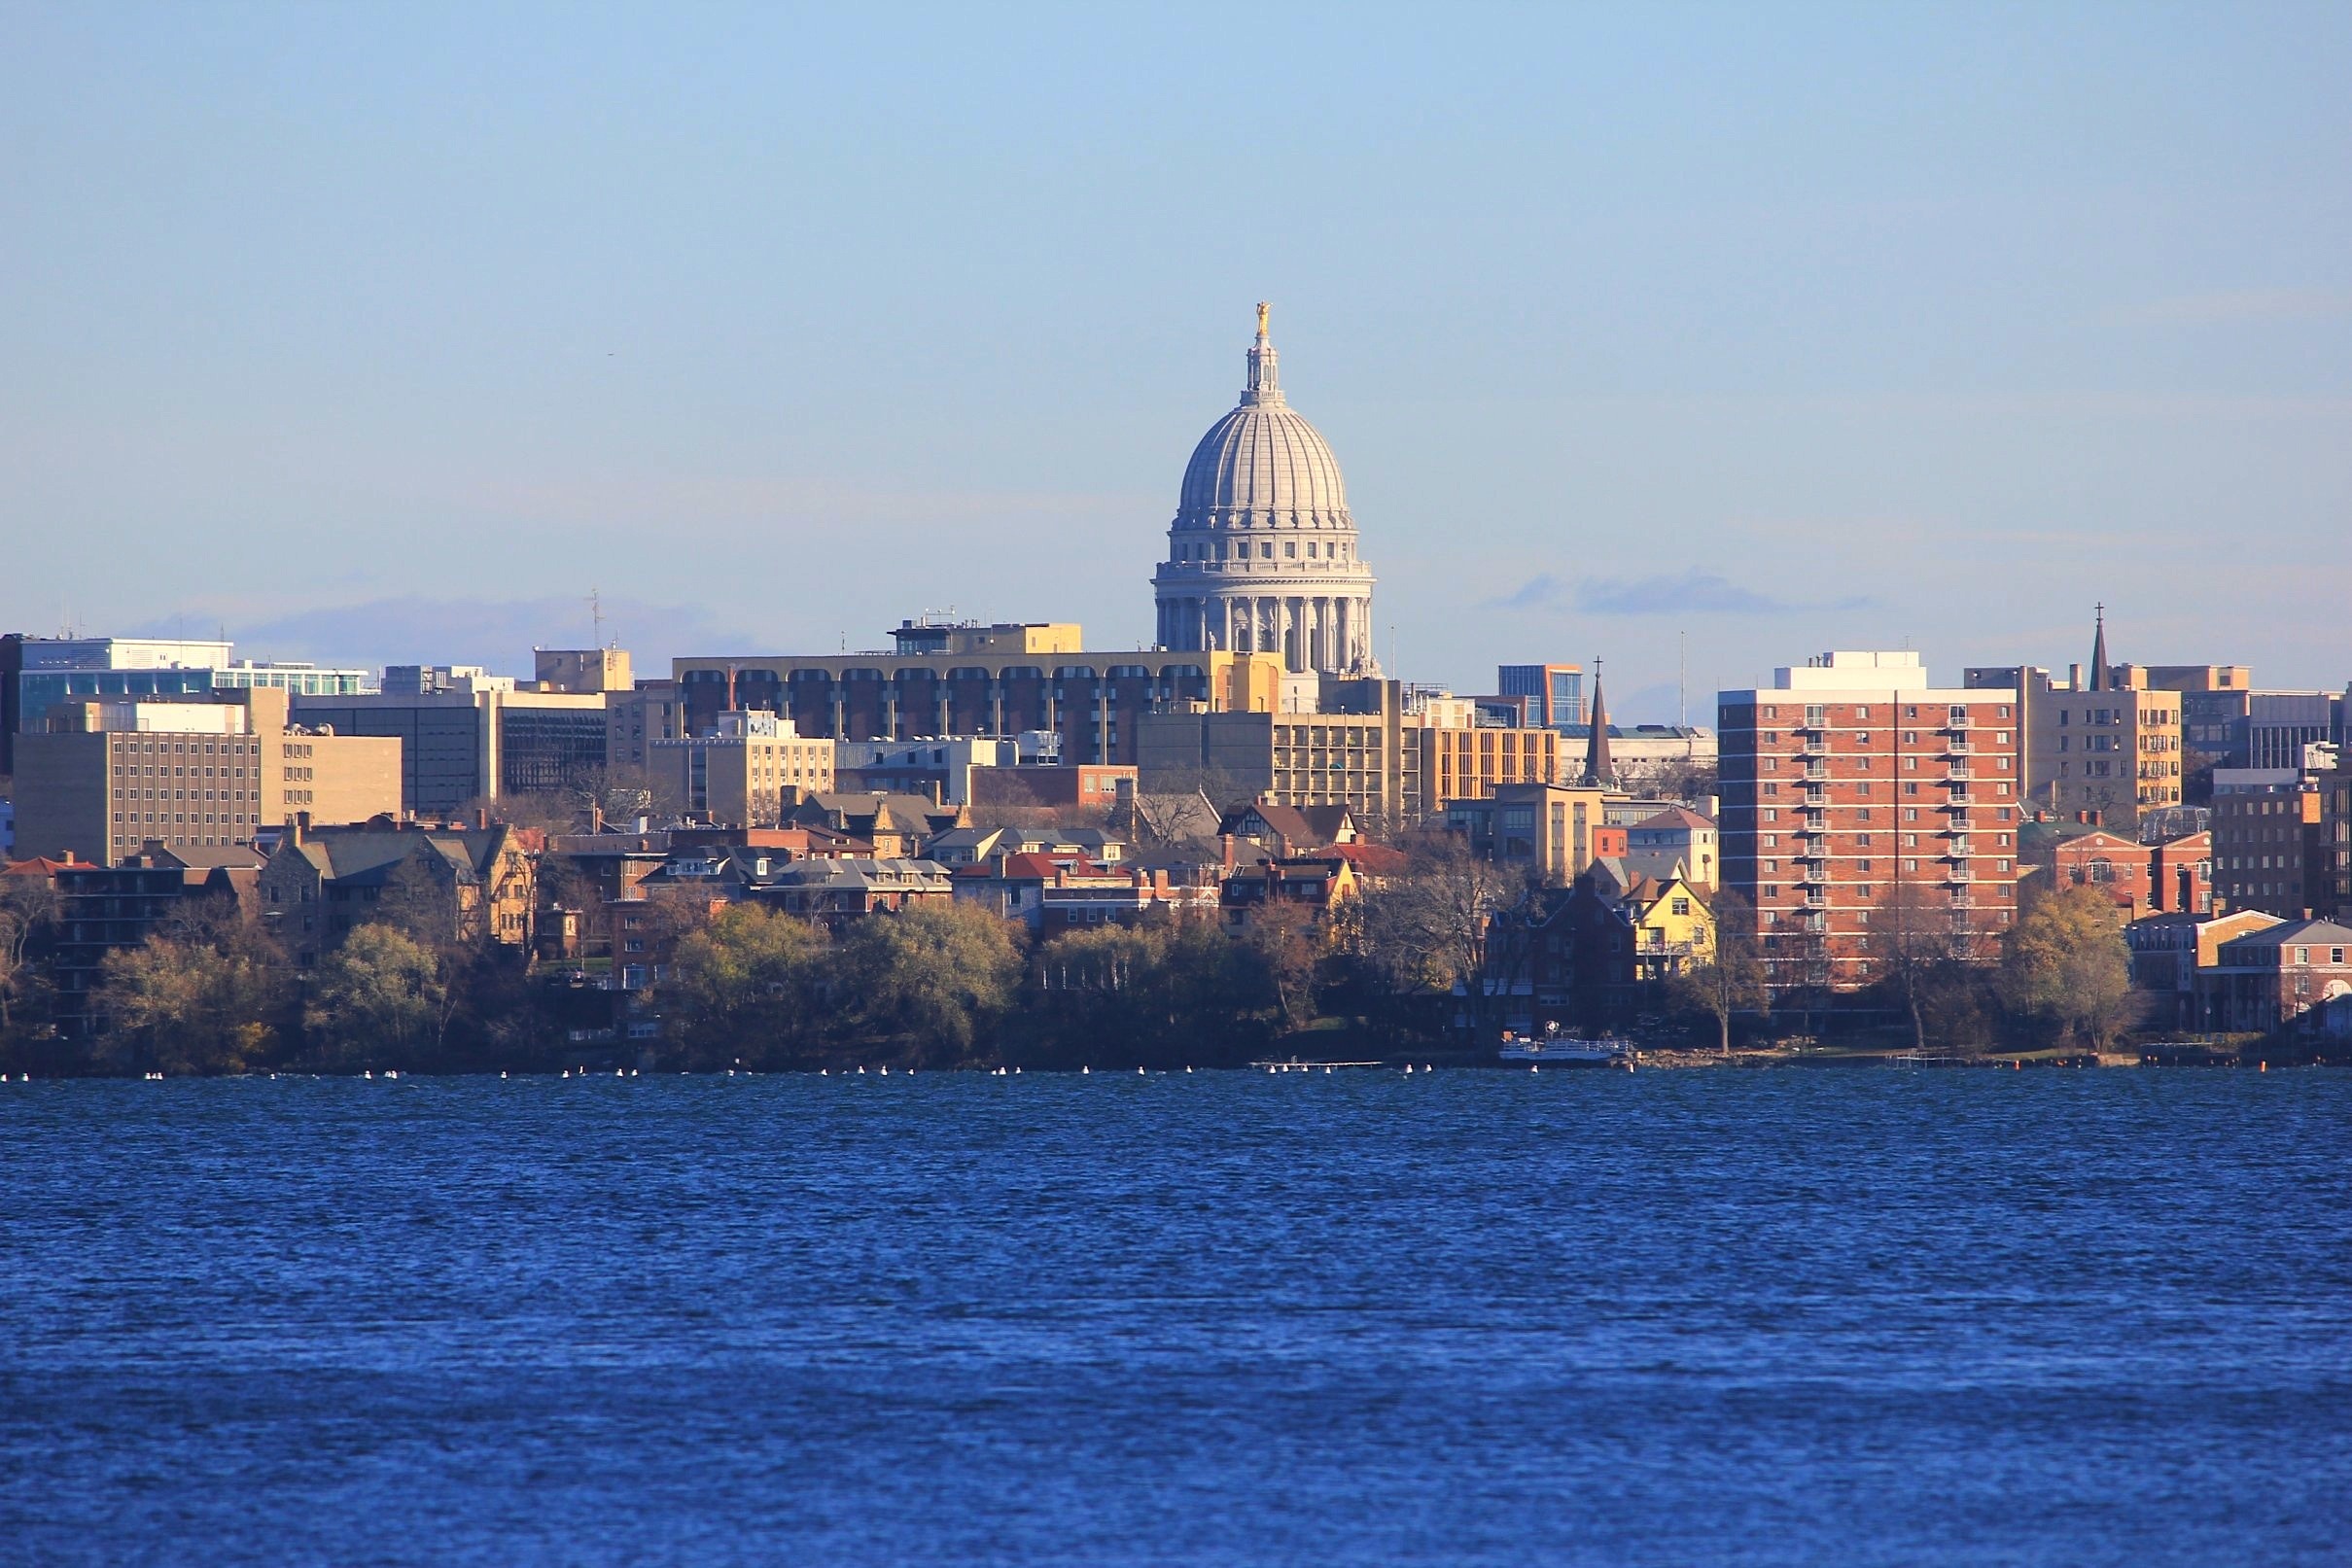
Of 410 regular elections in Wisconsin—299 (73%) are uncontested. An uncontested election is one where the number of candidates on the ballot is less than or equal to the number of seats up for election. Of the 26 states where Ballotpedia is covering every election on Nov. 5, Wisconsin has the fifth highest rate of…
-
43% of elections in Washington are uncontested
Of 384 regular elections in Washington—165 (43%) are uncontested. An uncontested election is one where the number of candidates on the ballot is less than or equal to the number of seats up for election. Of the 26 states where Ballotpedia is covering every election on Nov. 5, Washington has the 21st highest rate of…

