Voters in 206 Pivot Counties across the country backed Barack Obama (D) in 2008 and 2012 and Donald Trump (R) in 2016. How did these counties vote in 2020?
We have split the Pivot Counties into two categories based on the unofficial results:
- Retained Pivot Counties, which voted for Trump again in 2020, and
- Carousel Pivot Counties, which voted for Joe Biden (D) this cycle.
Preliminary analysis shows the following breakdown for the 206 Pivot Counties:
- 174 Retained Pivot Counties
- 20 Carousel Pivot Counties
- 12 unclear/too-close-to-call
Trump has been winning the 174 Retained Pivot Counties with an average margin of victory of 14.9 percentage points. Compared to his 2016 results, Trump's margin of victory decreased in 49 Retained Pivot Counties and increased in 125.
Biden has been winning the 20 Carousel Pivot Counties with an average margin of victory of 3.1 percentage points. Compared to Obama's results in 2012, the last time a Democrat won in these counties, Biden's margin of victory represents a decrease in 18 and an increase in two.
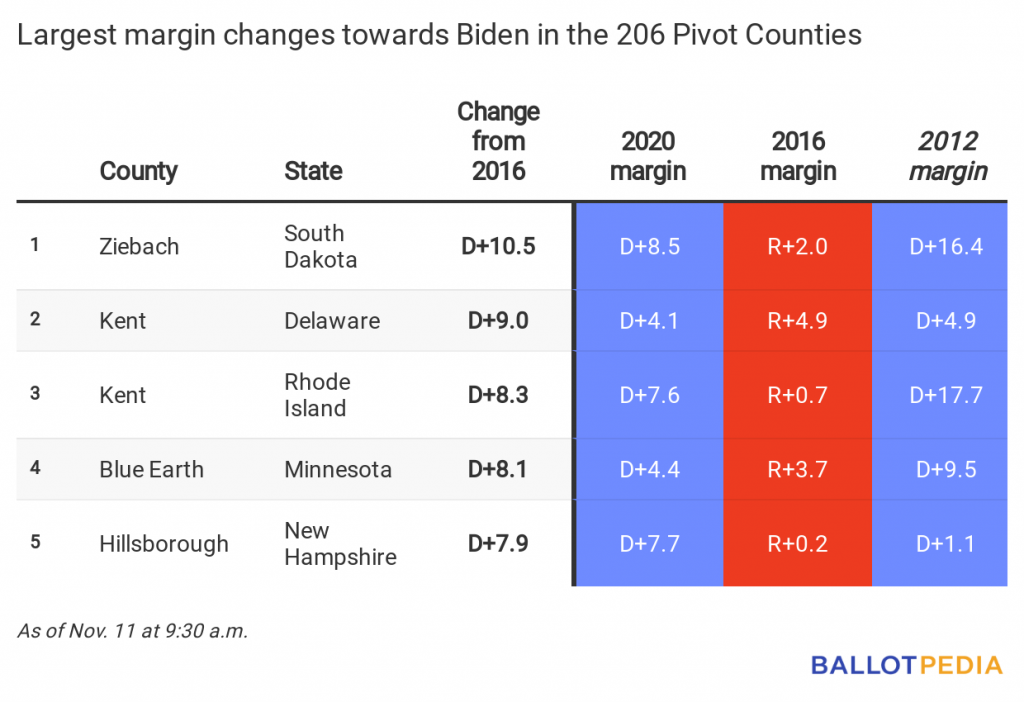
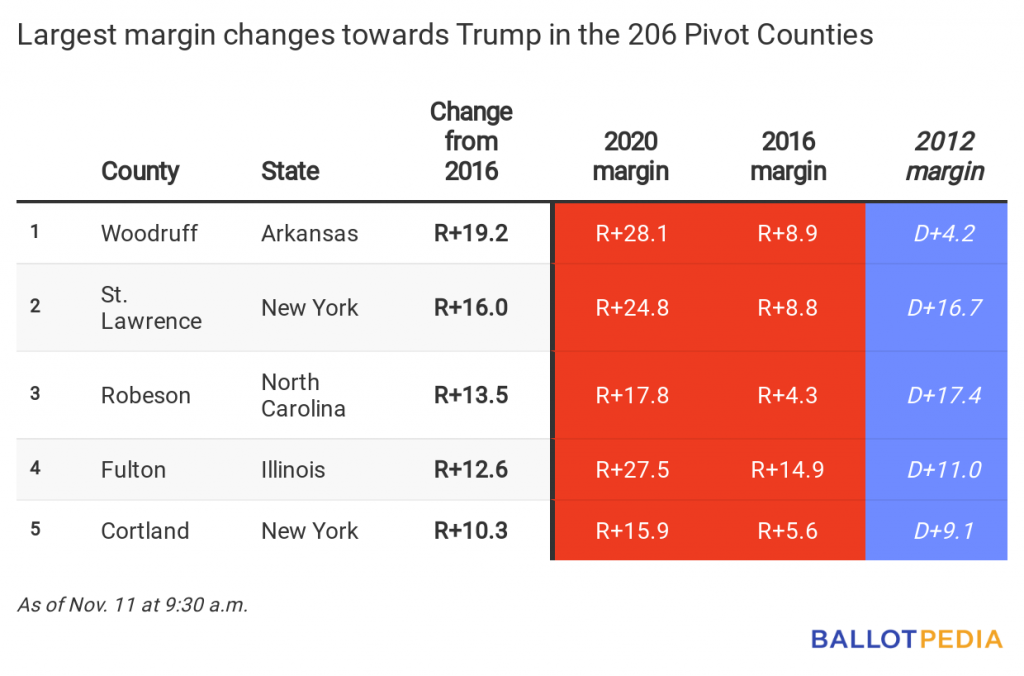
The five counties with the largest change in margin of victory for Democrats and Republicans since 2016 are in the tables below.
Trump:
Biden: