In today's final regular edition of The Runoff Report, we bring you the latest results and analysis of the Georgia Senate runoffs. Originally intended for yesterday, Jan. 6, we postponed the edition following the protests and riots surrounding Congress' certification of the presidential election. For more, see today's edition of The Transition Tracker.
Democrats win control of the Senate
Democrats won control of the U.S. Senate following Georgia's two runoff elections on Tuesday. Jon Ossoff (D) defeated David Perdue (R) in the regular runoff election. Raphael Warnock (D) defeated Kelly Loeffler (R) in the special runoff election. Georgia's last Democratic senator, Zell Miller, left office in 2005.
In the regular runoff election, Ossoff had 50.4% of the vote to Perdue's 49.6% as of Thursday morning. Ossoff will be the state's first Jewish senator.
Warnock won with 50.8% of the vote to incumbent Kelly Loeffler's (R) 49.2% as of Thursday morning. Warnock will be the first Black U.S. senator from Georgia.
Once sworn in after runoff results are certified, Ossoff and Warnock will bring the Democratic caucus to 50 members, splitting the chamber with 50 Republicans. The vice president—Kamala Harris (D) as of Jan. 20—has the tie-breaking vote in the chamber. Secretary of State Brad Raffensperger (R) has until Jan. 22 to certify runoff results.
Perdue was elected to the Senate in 2014, and his term ended Jan. 3. Gov. Brian Kemp (R) appointed Loeffler after Johnny Isakson (R) resigned at the end of 2019 for health reasons. Once sworn in, Warnock will serve the remaining two years of the term Isakson won in 2016.
Democrats last controlled the Senate from 2007 to 2015. Democrats currently hold a majority of 222-211 in the U.S. House.
Turnout
Around 4.5 million people voted in Georgia's runoffs, compared to 5 million during the November election. That's a turnout decrease of 10%.
Before this year, Georgia had held two runoffs for U.S. Senate: one in 2008 and one in 1992. In 2008, turnout between the general and runoff elections decreased by 43%. In 1992, turnout decreased by 44%.
The New York Times reported the following estimated runoff turnout breakdown:
Over all, turnout reached a remarkable 92 percent of 2020 general election levels in precincts carried by Mr. Biden in November, compared with 88 percent of general election levels in the precincts carried by Mr. Trump. These tallies include Upshot estimates of the remaining uncounted vote by precinct, and it suggests that nearly all of the Democratic gains since the November election can be attributed to the relatively stronger Democratic turnout.
A majority of Georgia’s Democratic voters are Black — they are roughly 30 percent of the overall electorate — and it was these voters who drove the stronger Democratic turnout. Over all, turnout reached 93 percent of 2020 levels in precincts where Black voters represented at least 80 percent of the electorate. In comparison, turnout fell to 87 percent of general election levels in white working-class precincts.
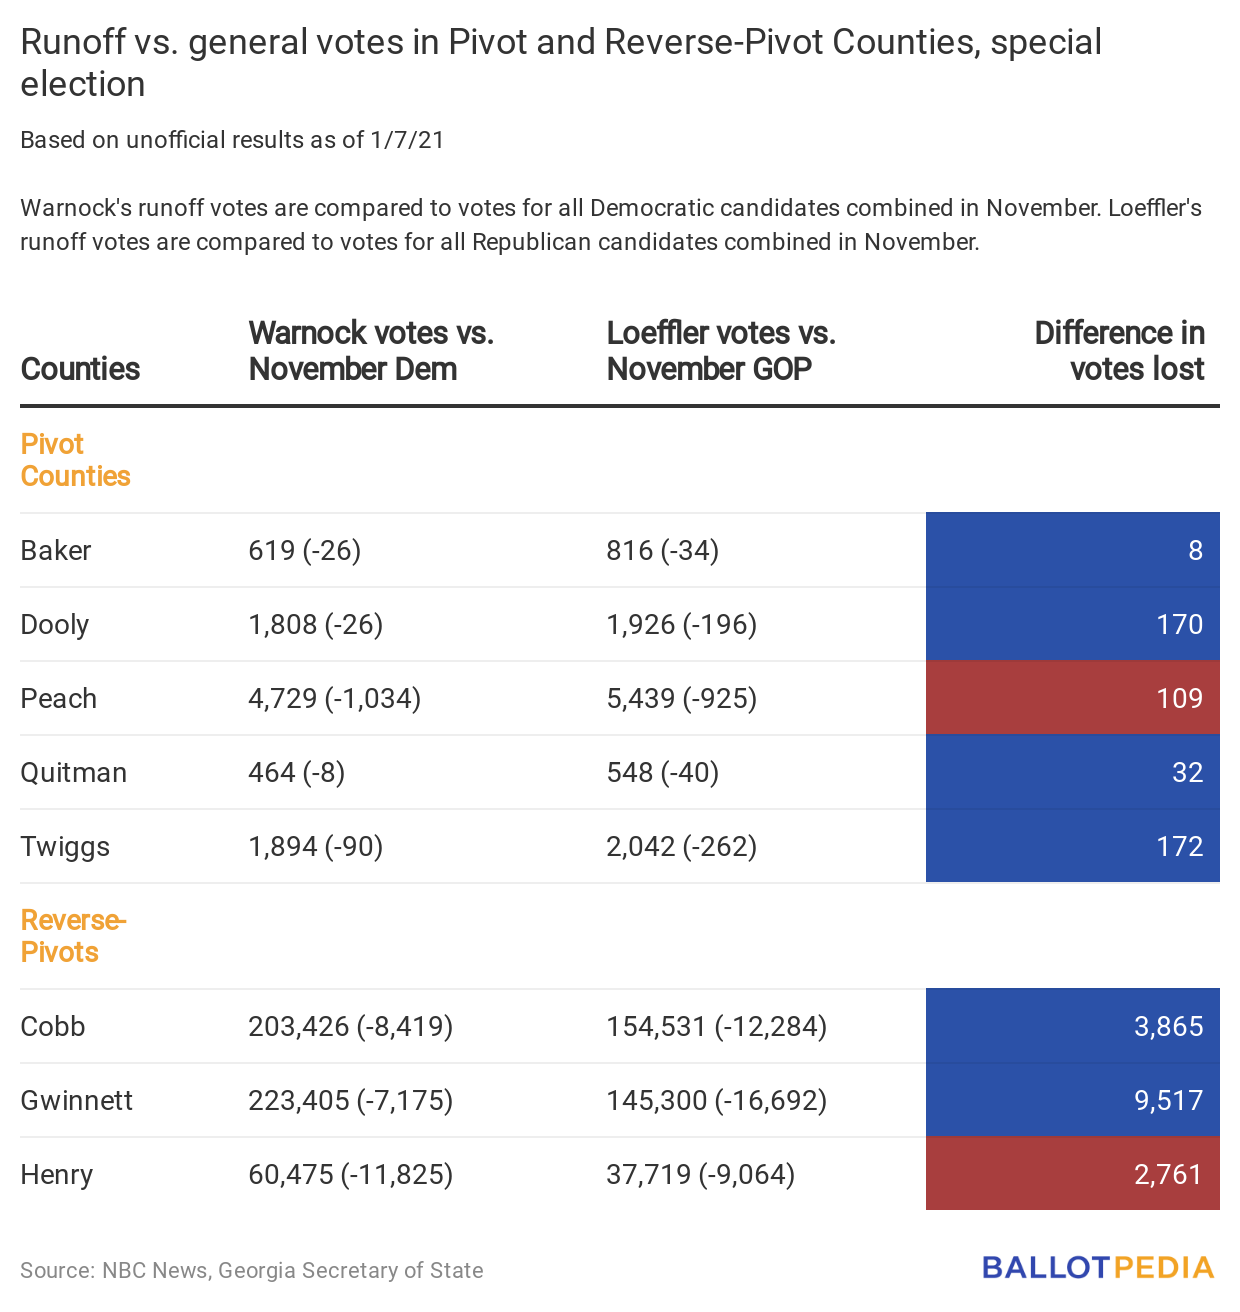
Pivot and Reverse-Pivot County voting
Last month, we looked at voting patterns in Georgia's Pivot and Reverse-Pivot counties. Here's how they voted in the Senate runoffs compared to the Senate races in November based on unofficial results available Thursday morning. Republican candidates won all Pivot Counties, and Democratic candidates won all Reverse-Pivot Counties. Below, we're focusing on differences in the number of votes between November and January in each county.
Georgia's five Pivot Counties voted for Barack Obama (D) in 2008 and 2012, then Donald Trump (R) in 2016. All five voted for Trump again in 2020.
Georgia's three Reverse-Pivot Counties voted for John McCain (R) in 2008 and Mitt Romney (R) in 2012 and then for Hillary Clinton (D) in 2016. All three supported Biden (D) in 2020.
The middle two columns show vote totals from the runoff election. The difference between runoff votes and general election votes are in parentheses. For example: Ossoff received 624 votes in Baker County in the runoff. That was 24 fewer votes than he received in the county in November.
The column on the right shows the difference between votes lost per county. Colors show which party lost fewer votes. For example, in Baker County, Ossoff lost 39 fewer votes than Perdue.