Welcome to the Tuesday, December 21, Brew.
By: Douglas Kronaizl
Here’s what’s in store for you as you start your day:
- Ballotpedia’s year-end analysis of statewide ballot measures
- The Ninth Day of Ballotpedia: Redistricting
- Incumbents won re-election in 86% of their Nov. races
Presenting Ballotpedia’s year-end analysis of statewide ballot measures
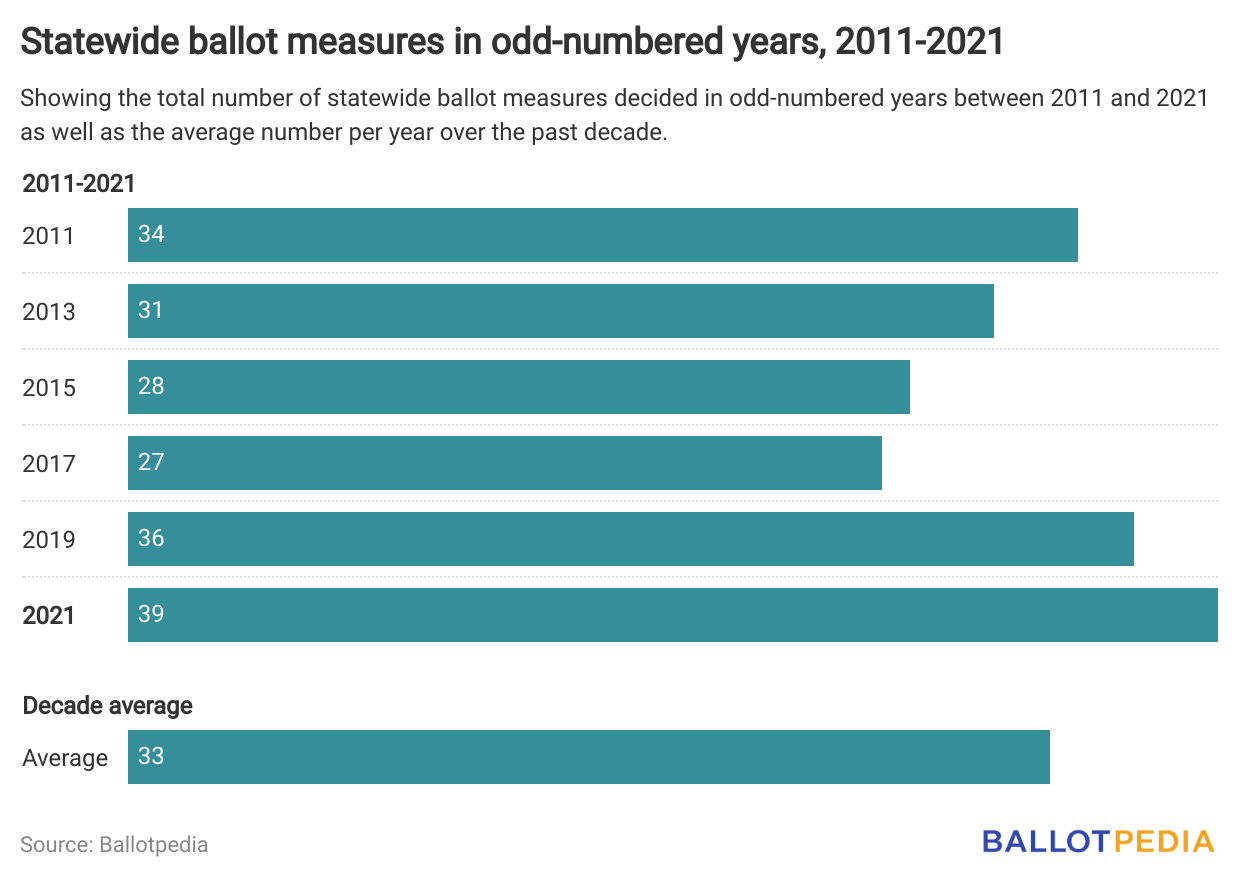
This year saw more statewide ballot measures than any odd-numbered year since 2007.
That is just one of many facts you’ll find in Ballotpedia’s year-end analysis of the 39 statewide ballot measures voters decided in 2021. Voters in nine states approved 26 measures and defeated 13 on four different election dates. The year-end analysis digs into the types and origins of these measures, the outcomes, campaign finance and signature-gathering costs, and ballot language readability.
Here are some highlights:
- On average, there have been 33 ballot measures in eight states during odd-numbered years over the past decade.
- State legislatures referred 32 questions to the ballot, of which voters approved 25 and rejected seven.
- Four citizen initiatives made it to the ballot in 2021. Three were in Colorado—all of which were defeated—and voters approved one in Maine.
- In 2021, statewide ballot measure campaigns raised $107 million. Most of that came from a single campaign, though. Supporters and opponents of Maine Question 1 raised a combined $99.6 million, 93% of the total contributions for all statewide ballot measures this year.
- The campaign opposing Maine Question 1 spent $448.61 for every vote against the measure, the highest cost-per-vote (CPV) of any statewide ballot measure campaign since at least 2016.
- In total, the campaign behind the three initiatives in Colorado spent $3.33 million on signature gathering, amounting to an average cost-per-required signature of $8.42.
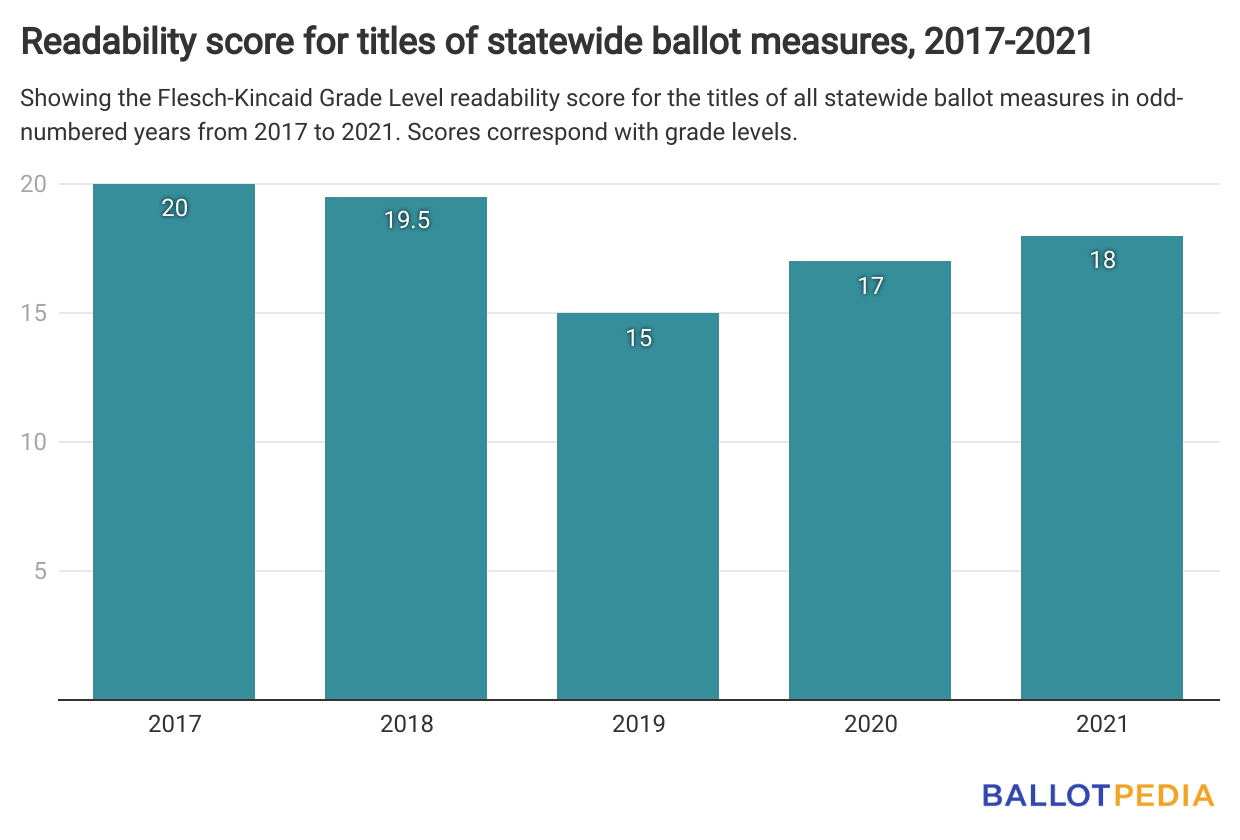
- The average Flesch-Kincaid Grade Level readability score for the ballot titles of all 39 statewide ballot measures was 18, equivalent to a second-year graduate school reading level.
The Ninth Day of Ballotpedia: Redistricting
As readers of the Brew, you know firsthand the ways we here at Ballotpedia help you make sense of the ins and outs of redistricting. With your help and support, we have been able to find even more ways to make the process easier to follow!
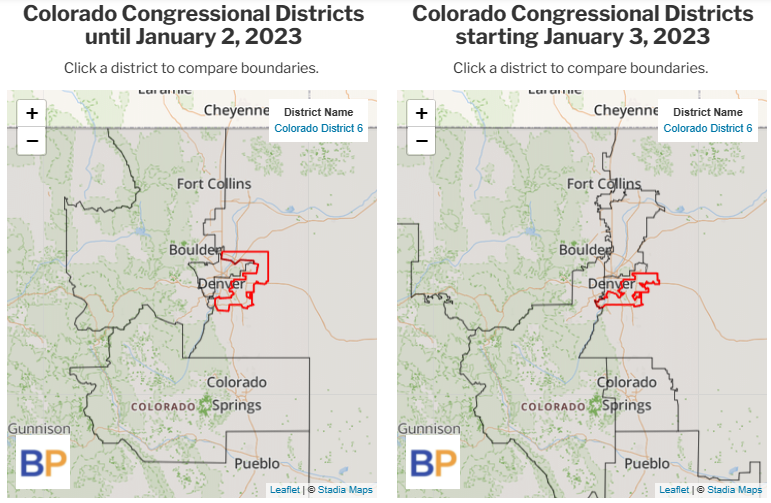
The redistricting process can be complicated and confusing for even the most informed voters, reporters, and researchers. That’s why our team has developed a new visual tool that will allow you to immediately see what redistricting looks like in your state and all the others.
Our side-by-side map widget helps you see and understand how redistricting changed—and is changing—district boundaries. And because of the zooming capabilities, you can get up close to see how districts compare to one another!
Without the support of our donors and the Ballotpedia community, we would not be able to develop innovative tools like these to help voters make sense of the ever-changing political landscape. Consider making a donation today so we can continue to produce this information for all who seek it.
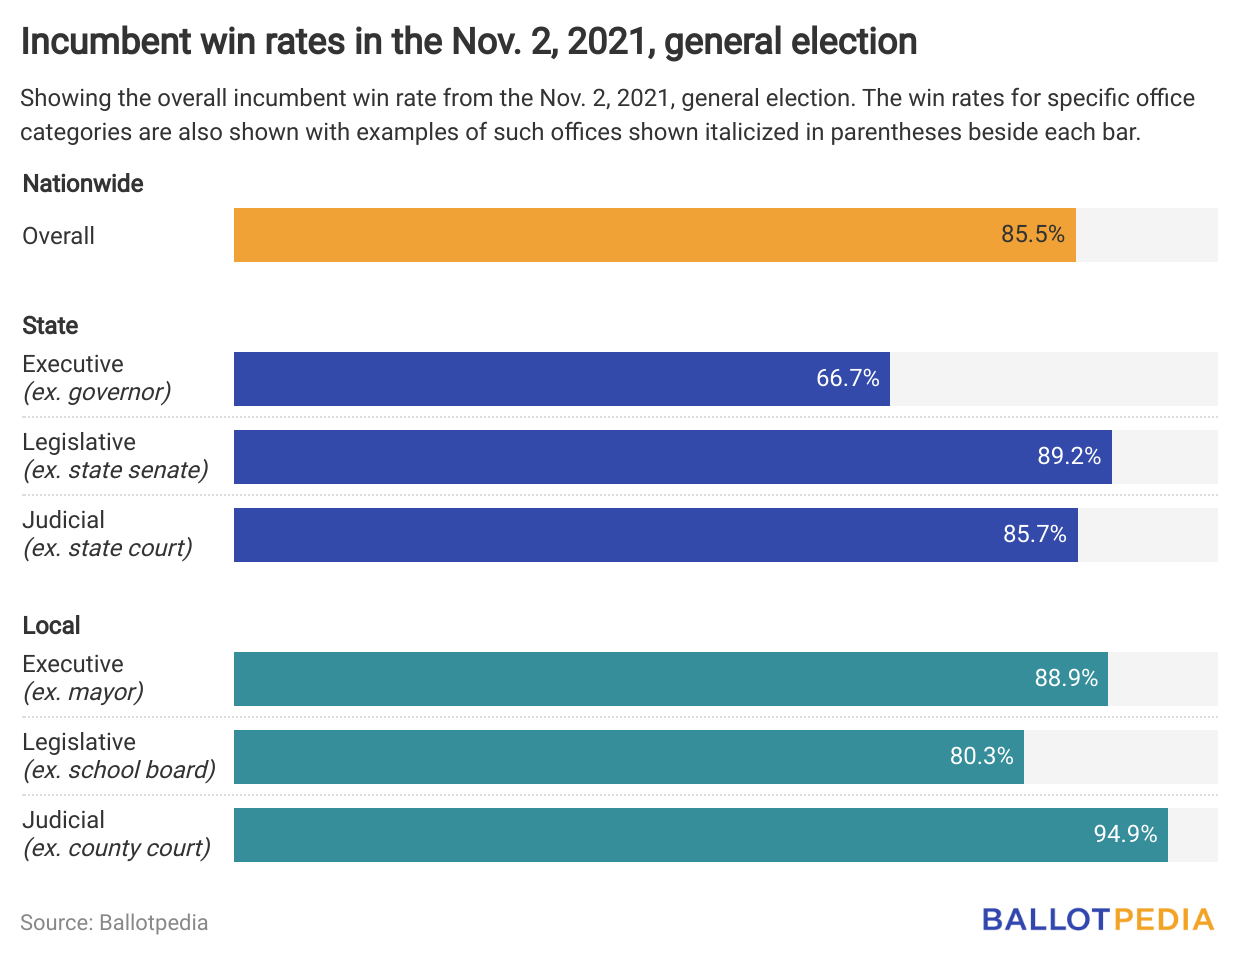
Incumbents won re-election in 86% of their Nov. races
In the Nov. 2, 2021, general election, 86% of incumbents nationwide won their re-election bids (within the scope of elections we cover). That number drops to 82% when you include incumbents who withdrew before the general election or were disqualified from the ballot.
This is a lower incumbent re-election rate than in recent years. In 2020, 93% of incumbents won their general elections. In 2019, the rate was 90% and it was 92% in 2018.
When looking at the specific categories of elected offices we covered in 2021, we found that state executive incumbents had the lowest win rate at 67%. But lower overall numbers of incumbents running for re-election drove that figure down. Only three state executive incumbents sought re-election in 2021 and, of those three, one—Virginia Attorney General Mark Herring (D)—lost.
When looking at offices with substantial sample sizes, we found that incumbents in local legislative offices—city councils, school boards, county commissions—had the lowest win rate with 80%. Incumbents in local judicial races had the highest win rate at 94.9%.
Incumbents in Minnesota were the least successful in 2021 with a win rate of 55% followed by Kansas with 59% and Colorado with 67%.
Keep reading