


Welcome to the Friday, November 18, Brew.
By: Douglas Kronaizl
Here’s what’s in store for you as you start your day:
- Tracking school board conflicts by the numbers
- Twenty-two states in 2018 and 2020 elected statewide candidates from a different party
- #FridayTrivia: How many states elected a governor and U.S. Senator from a different party (so far)?
Tracking school board conflicts by the numbers
Since 2021, we’ve tracked school board elections where topics regarding race in education, coronavirus responses, or sex and gender in schools come into play.
To date, we have tracked 1,451 races, involving 9,419 candidates.
Of that total, 561 school districts across 26 states held elections on Nov. 8 featuring at least one of the three conflict topics with 1,800 seats up for election.
We are hard at work identifying the winners in these races and seeing where they stand on the three conflict topics.
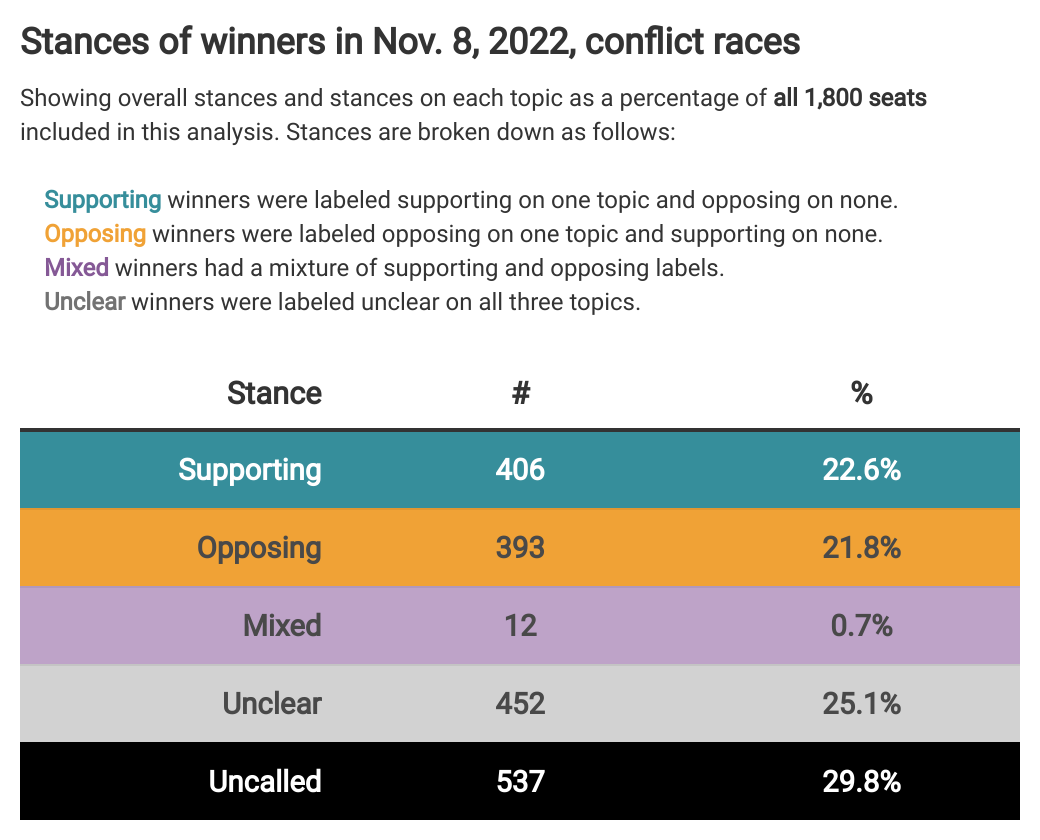
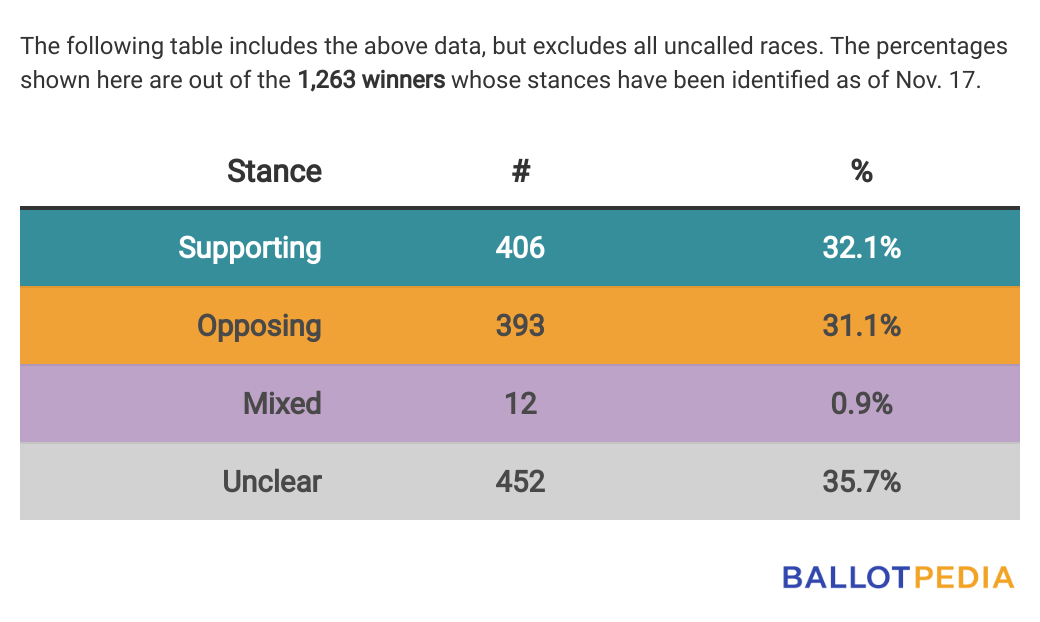
As of Nov. 17, we have completed our research on 1,263, or 70%, of the 1,800 winners from the Nov. 8 elections. Here’s an update on what we have found so far.
As part of this research, we label each winner as either supporting or opposing the three conflict topics. If we cannot determine a stance, we mark the winner unclear.
Broadly, a candidate is labeled supporting if they support things like including the role of race in curricula or learning materials, mask and/or vaccine requirements, or the inclusion of topics in sexual education regarding orientations and gender identities.
A candidate is labeled opposing if they oppose things like critical race theory, mask and/or vaccine requirements, or comprehensive sexual education.
After identifying a winner’s stances on all three issues, we then group candidates together into four categories:
- Supporting, if the winner was labeled supporting on at least one topic and opposing on none.
- Opposing, if the winner was labeled opposing on at least one topic and supporting on none.
- Mixed, if the winner was labeled as supporting on at least one topic and opposing on another.
- Unclear, if the winner was labeled unclear on all three topics, meaning we could not definitively categorize the winner under one of the above labels.
The following tables show results from our work conducted so far. Supporting and opposing candidates have won roughly the same number of seats, with unclear candidates making up a slightly larger number.
These values are not win rates, instead, they show the percentage of the seats that will be held by candidates based on their stances.
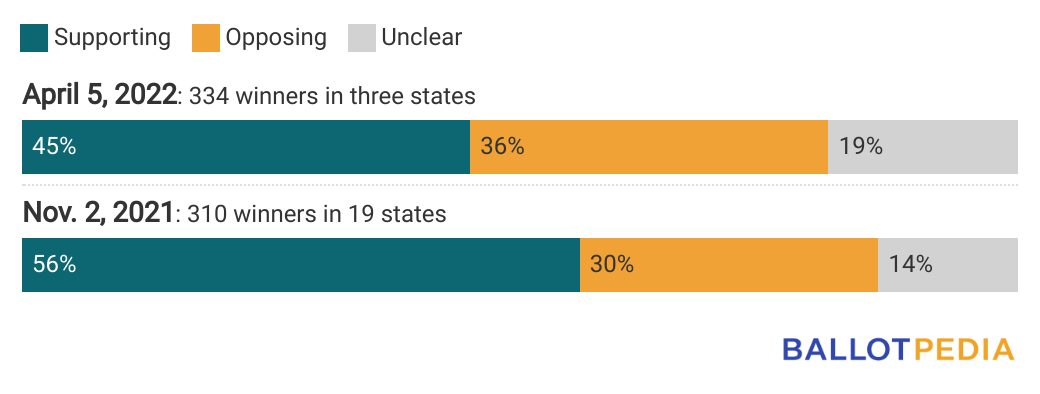
This is the third school board conflict results analysis Ballotpedia has conducted since 2021. Results from previous analyses are shown below:
We will be back with the final results after Thanksgiving. Until then, you can follow our progress using the link below.
Twenty-two states in 2018 and 2020 elected statewide candidates from a different party
Earlier this week, we looked at the states that elected a U.S. Senator and a governor from a different party in the Nov. 8 elections (more details below in this week’s trivia). Continuing this ticket-splitting theme, let’s look at the states where voters elected statewide candidates from different parties in the 2018 and 2020 general elections.
We’ll also look at the difference in votes separating the winning candidate who received the most votes from the winning candidate who received the fewest votes.
In the majority of states that held statewide elections in 2018 and 2020, voters elected candidates for statewide offices from the same party. But a combined 22 states in both years elected candidates from more than one party in statewide elections.
In 2018, 14 states elected statewide candidates from more than one party. In 2020, that number was eight.
2020
In Arizona, Georgia, Michigan, North Carolina, New Hampshire, New Mexico, Pennsylvania, Vermont, and Washington, voters elected statewide candidates from different parties.
The table below shows the highest vote-getting and lowest vote-getting candidates and the offices they won. Cells are colored according to the candidate’s party affiliation.
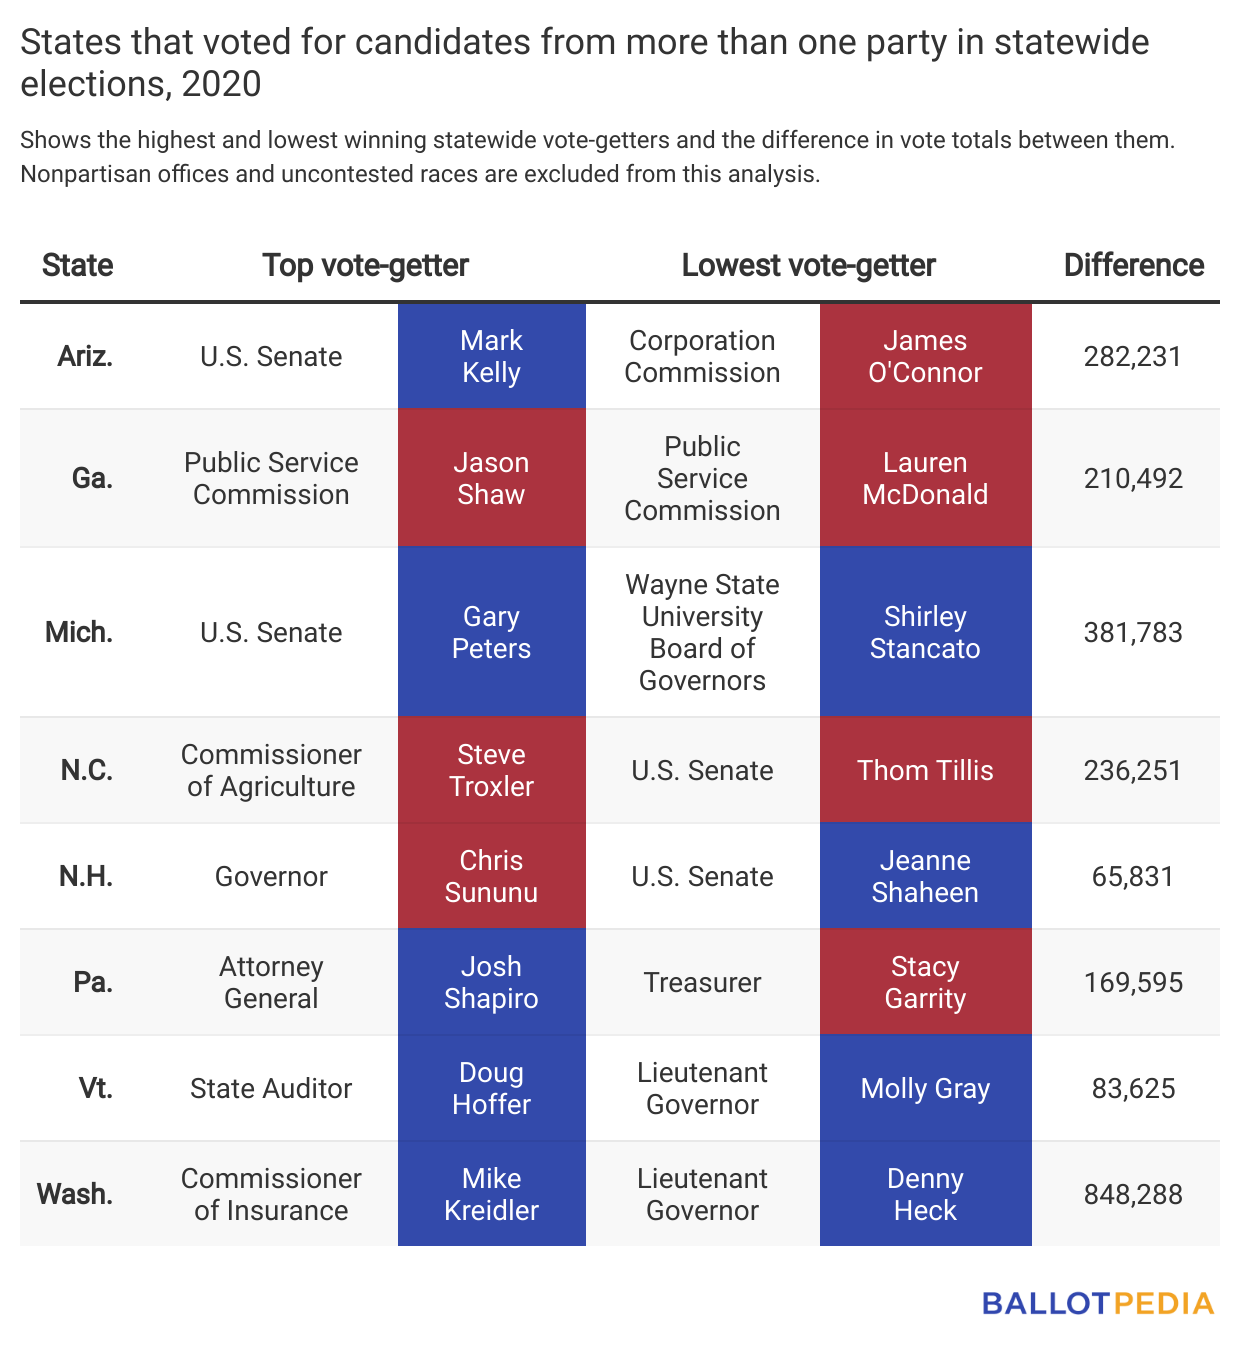
On average, in 2020, more than 163,972 votes separated the winning candidate with the most votes and the winning candidate with the fewest votes.
To put it another way, the lowest winning vote-getter received on average only 85% of the votes of the highest winning vote-getter. For example, in North Carolina in 2020, commissioner of agriculture candidate Steve Troxler (R) received 2,901,849 to win the office, while incumbent U.S. Sen. Thom Tillis (R) received 2,665,598 to win the office—a difference of 236,251 votes.
In Washington, commissioner of insurance candidate Mike Kreidler (D) received 2,506,693 votes, whereas lieutenant governor candidate Denny Heck (D) received 1,658,405 votes—a 40% difference.
The chart below shows the vote difference between the winning candidate with the highest number of votes and the winning candidate with the lowest number of votes. Colors at the end-points of each bar represent the winning candidate’s party affiliation.
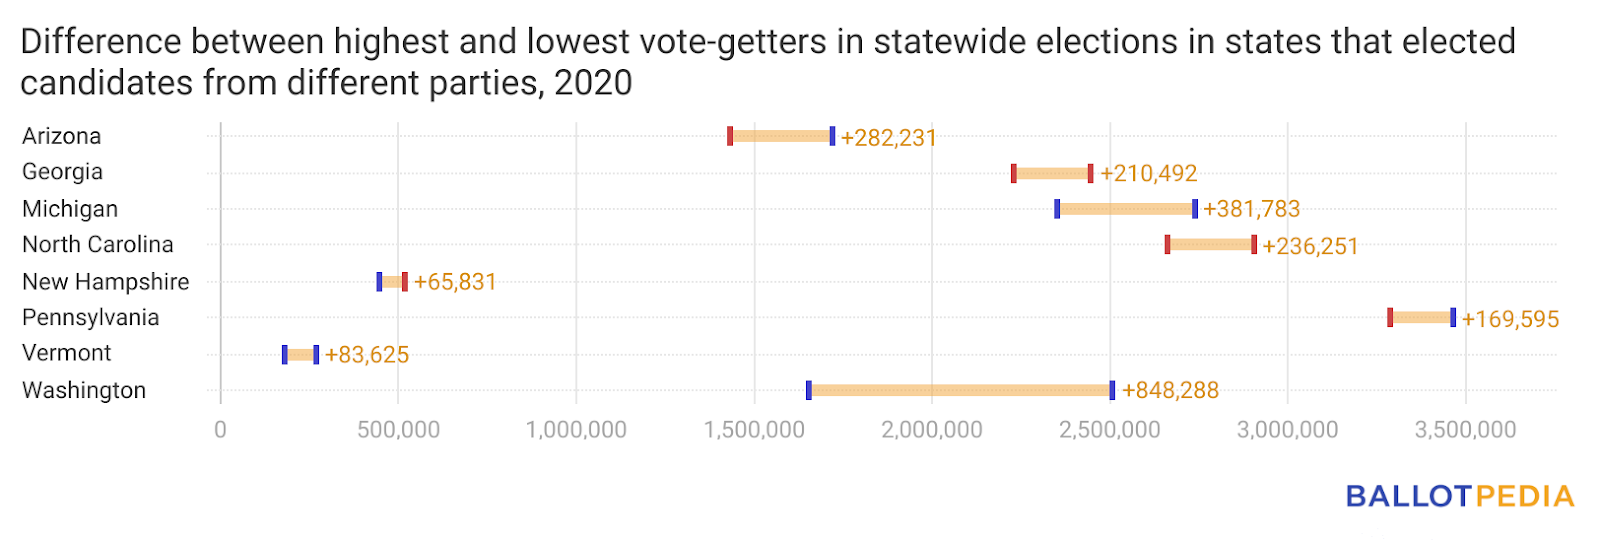
The three states with the biggest gap between the winning candidate with the highest votes and the winning candidate with the lowest votes were:
- Washington (848,288)
- Michigan (381,783)
- Arizona (282,231)
The three states with the smallest gap between the winning candidate with the highest votes and the winning candidate with the lowest votes were:
- New Hampshire (65,831)
- Vermont (83,625)
- Pennsylvania (169,595)
2018
In Arizona, Florida, Iowa, Kansas, Massachusetts, Maryland, Maine, Michigan, Missouri, Montana, North Dakota, Nevada, Ohio, and Vermont, voters elected statewide candidates from different parties.
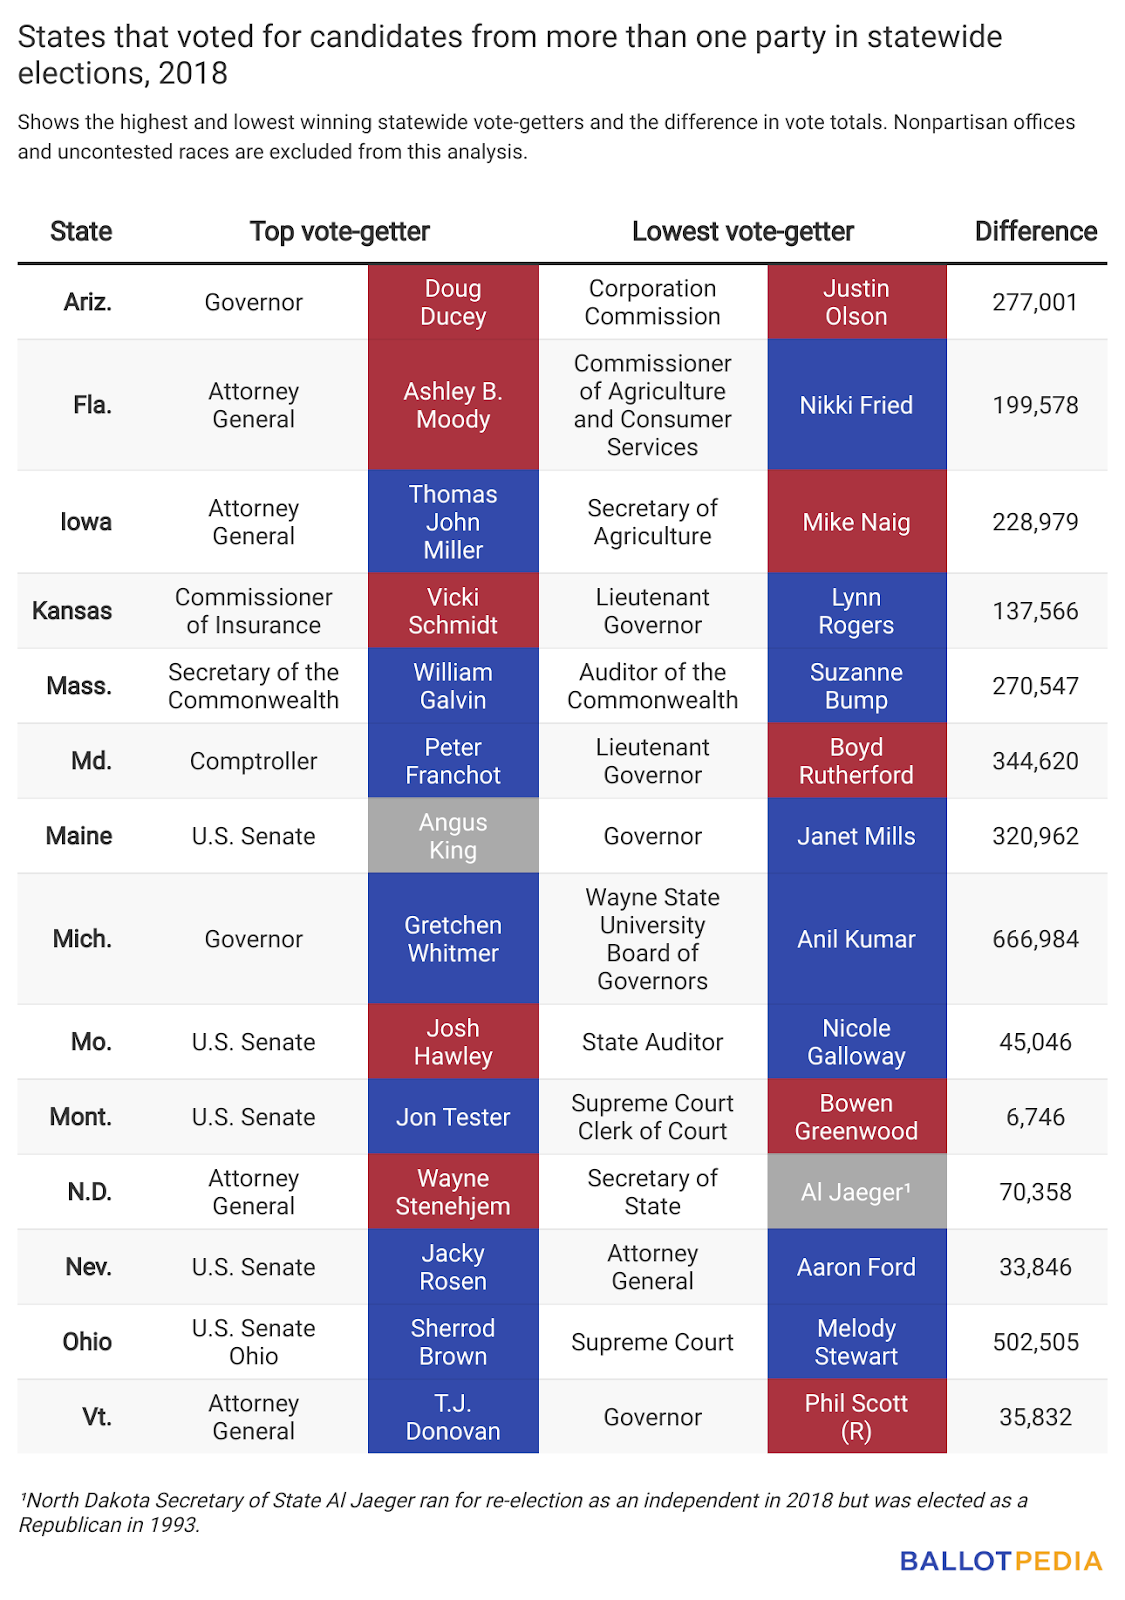
In 2018, an average of 203,087 votes separated the winning candidate with the most votes and the winning candidate with the fewest votes. The lowest winning vote-getter received on average only 83% of the votes of the highest winning vote-getter.
For example, in Florida, the winner of the attorney general election, Ashley B. Moody (R) received 4,232,532. The winner of the commissioner of agriculture and consumer services election, Nikki Fried (D), received 4,032,954.
In Maryland, the winner of the comptroller election, Peter Franchot (D), received 344,620 more votes than Boyd Rutherford (R), the winner of the lieutenant governor race.
The chart below shows the vote difference between the winning candidate with the highest number of votes and the winning candidate with the lowest number of votes. Colors at the end-points of each bar represent the winning candidate’s party affiliation.

The three states with the biggest gap between the winning candidate with the highest votes and the winning candidate with the lowest votes were:
- Michigan (666,984)
- Ohio (502,505)
- Maryland (344,620)
The three states with the smallest gap between the winning candidate with the highest votes and the winning candidate with the lowest votes were:
- Montana (6,746)
- Maine (23,613)
- Nevada (33,846)
#FridayTrivia: How many states elected a governor and U.S. Senator from a different party (so far)?
On the topic of ticket-splitting, in last Monday’s Brew, we shared our analysis of split-ticket voting in this year’s statewide general elections. Twenty-six states held elections for governor and U.S. Senate on Nov. 8. Of that total, we have called races in 24 states. Races for both offices in Alaska remain uncalled and Georgia voters, who re-elected Gov. Brian Kemp (R), have to wait until a Dec. 6 runoff to pick their Senator.
Of the 24 states where we have full results available, how many elected a governor and U.S. Senator from a different party?