

Welcome to the Monday, August 14, 2023, Brew.
Here’s what’s in store for you as you start your day:
- 1.5% of all absentee/mail-in ballots were rejected in 2022
- Twenty-one federal judicial vacancies on the horizon
- 54.94% of state legislators are Republican, 44.35% Democratic
1.5% of all absentee/mail-in ballots were rejected in 2022
Nationwide, voters cast 36,683,450 absentee/mail-in ballots in the 2022 general election. Of that total, 549,824—or 1.5%—were rejected. That’s roughly equal to the 1.4% rejection rate in 2018, the most recent midterm election, and up from the 1.0% and 0.8% rejection rates in the 2016 and 2020 presidential election cycles, respectively.
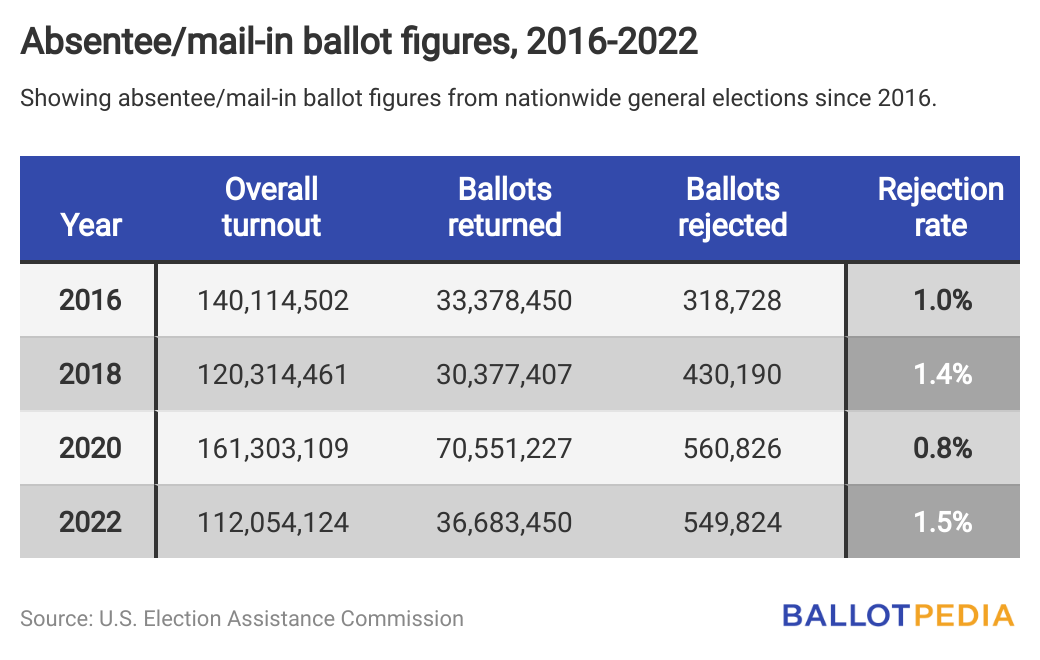
Between the midterm election cycles in 2018 and 2022, the absentee/mail-in ballot rejection rate increased in 17 states. It decreased in 31 states and Washington, D.C. Comparative data was unavailable for Alabama and Mississippi.
This data comes from the U.S. Election Assistance Commission’s (EAC) biannual Election Administration and Voting Survey released last June. Under the Help America Vote Act, the EAC must compile a report detailing election statistics and policy figures after every even-year election cycle. The EAC does not conduct its own research but rather aggregates survey responses from election officials across the country.
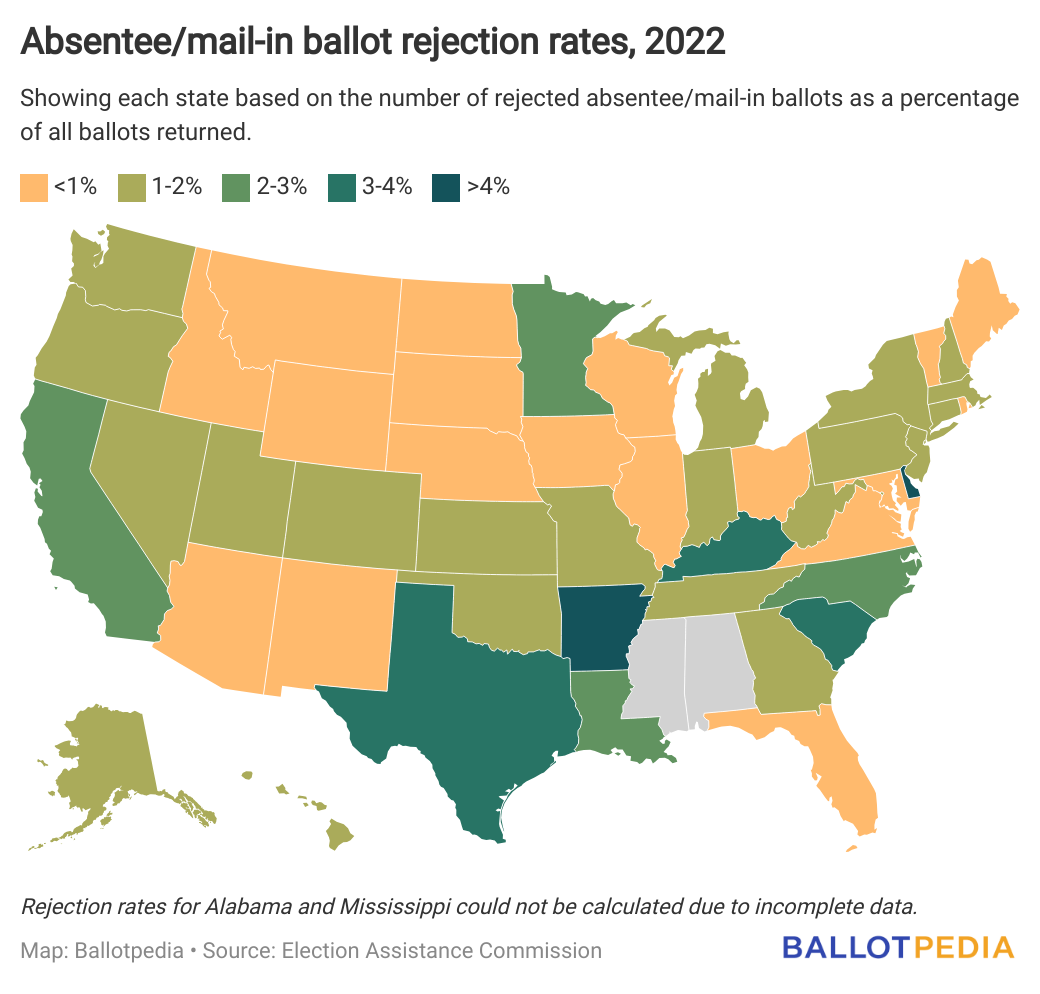
Delaware had the highest rejection rate in 2022 at 13.2%, up from 5.0% in 2018 and 1.3% in 2020.
The EAC does not say why Delaware’s rejection rate increased. But it notes that election officials rejected roughly 86% of absentee/mail-in ballots for some reason other than a missing signature, missed deadline, or issue with the return envelope.
Delaware requires voters to have a valid excuse in order to request an absentee/mail-in ballot. Legislators attempted to change state law to allow any voter to cast such a ballot in 2022. The state supreme court declared those changes unconstitutional one month before the general election.
Arkansas (6.8%), Texas (3.4%), Kentucky (3.3%), and South Carolina (3.2%) followed with the highest rejection rates in 2022.
Idaho had the lowest rejection rate, at effectively 0.0%. The state reported rejecting one absentee/mail-in ballot in Fremont County. Camas County reported no rejections, while the state’s remaining 42 counties indicated they lacked rejected ballot data.
Vermont (0.1%), Iowa (0.2%), Ohio (0.3%), and South Dakota (0.4%) followed with the year’s lowest rejection rates.
Every state has some form of absentee/mail-in voting.
State rules vary over who and how people can vote absentee or through the mail. There are three broad categories:
- Automatic systems, where every voter receives an absentee/mail-in ballot automatically;
- Request-required with no excuse, where every voter can request an absentee/mail-in ballot; and,
- Request-required with an excuse, where only certain voters can request an absentee/mail-in ballot if they have a valid excuse.
In 2022, eight states and Washington, D.C., used automatic systems, 27 states used request-required with no excuse, and 15 states used request-required with an excuse.
Higher rejection rates were more common in states that used request-required with an excuse. Eleven of those states had rates exceeding the national rate (1.5%), compared to two with lower rates.
Lower rejection rates were more common in states that used request-required with no excuse. Twenty-two of those states had rates lower than the national rate, compared to five with higher rates.
In states with automatic systems, three and D.C. had rejection rates above the national rate, and six had lower rejection rates.

The EAC asks states to provide reasons for each rejected ballot, if available, using a pre-selected list of topics like a missed deadline, non-matching signature, or problems with return materials.
In 2022 and 2018, the most common reason was “other reason not listed”, accounting for 33% of all rejected ballots last year. This includes all reasons apart from those specified in the EAC’s survey.
In the 2016 and 2020 presidential elections, the most common reason was a “non-matching signature”, accounting for 33% and 28% of all rejections, respectively. This means the signature on the absentee/mail-in ballot did not match the signature election officials had on file for the voter.
You can learn more about the EAC's methodology here and can read the full 2022 report here.
To view our full analysis of rejected absentee/mail-in ballots in 2022, plus state-specific comparisons since 2016, use the link below.
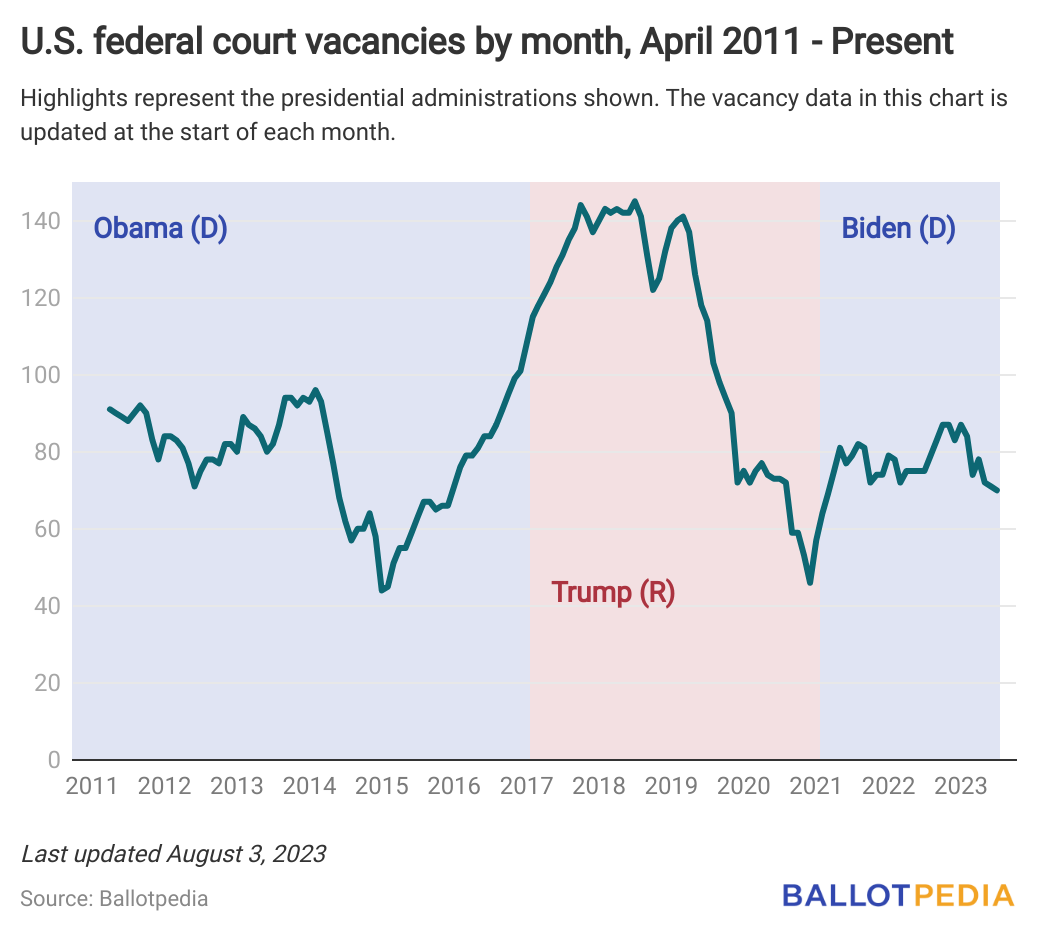
Twenty-one federal judicial vacancies on the horizon
There were 21 total announced upcoming vacancies for Article III judgeships as of Aug. 8, according to the latest vacancy data from the U.S. Courts.
Article III judgeships refer to federal judges who serve on the U.S. Supreme Court, the U.S. Court of International Trade, or one of the 13 U.S. courts of appeal or 94 U.S. district courts. These are lifetime appointments made by the president and confirmed by the U.S. Senate.
These positions are not yet vacant but will be at some point in the future with every judge having announced their intent to either leave the bench or assume senior status. In the meantime, these judges will continue to serve in their current positions. The president and Senate do not need to wait for a position to become vacant before they can start the confirmation process for a successor. There are currently two nominees pending for upcoming vacancies.
Six vacancy effective dates have not been determined because the judges have not announced the date they will leave the bench. The next upcoming scheduled vacancy will take place on Aug. 9, when U.S. District Court for the Southern District of New York Judge Paul Gardephe assumes senior status.
In addition to these 21 upcoming vacancies, there are 69 current Article III vacancies in the federal judiciary out of the 870 total Article III judgeships. Including non-Article III judges from the United States Court of Federal Claims and the United States territorial courts, there are 70 vacancies out of 890 active federal judicial positions.
President Joe Biden (D) has nominated 176 individuals to federal judgeships on Article III courts. Of those, 140 nominees have been confirmed. As of Aug. 8, 14 of the 31 nominees going through the confirmation process are awaiting a vote in the full Senate, six are awaiting a committee vote, and 11 are awaiting a committee hearing.
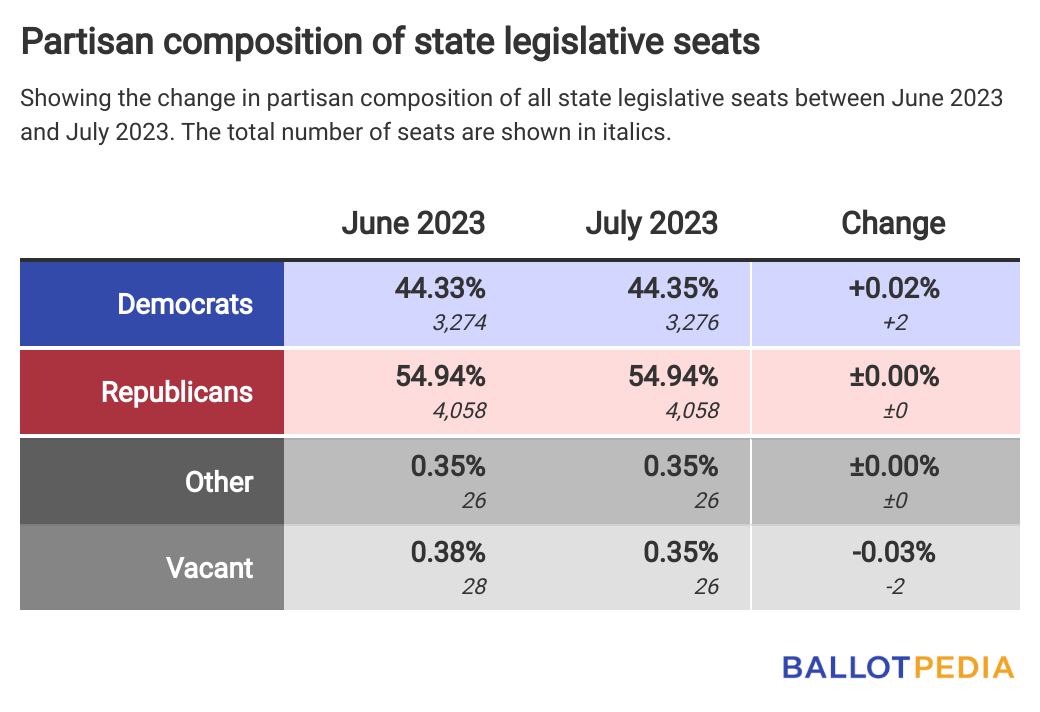
54.94% of state legislators are Republican, 44.35% Democratic
At the end of July 2023, 54.94% of all state legislators in the United States were Republican while 44.35% were Democratic. There are 7,386 state legislative seats in the country.
Democrats held 853 state Senate seats and 2,423 state House seats, gaining two seats overall since the previous month. Republicans held 1,110 state Senate seats and 2,948 state House seats, the same number they held in the previous month.
Independent or third-party legislators held 26 seats across 12 different states, including 21 state House seats and five state Senate seats. There were 21 House vacancies and five Senate vacancies across 19 different states.
Compared to July 2022, Democrats lost ten state Senate seats (863 v. 853) and gained 12 state House seats (2,411 v. 2,423). Republicans gained 17 state Senate seats (1,093 v. 1,110) and 44 state House seats (2,904 v. 2,948).