

Welcome to the August 15, 2023, Brew.
Here’s what’s in store for you as you start your day:
- A look at school board elections in South Dakota
- A roundup of city council candidates’ answers to our candidate survey
79% of South Dakota school districts canceled elections this year
In many states, elections are canceled outright if candidates run uncontested. Our experience covering school board elections comprehensively in 10 states this year paints a picture of how common this occurrence is - we previously wrote about Oklahoma and Wisconsin - now let’s explore South Dakota.
Every school district in South Dakota -149 of them - was scheduled to hold school board elections in 2023. However, only 21% held an election - the rest canceled elections entirely. Those 117 (79%) districts canceled because there weren’t enough candidates to hold a contested election - meaning less than or equal to the number of seats as candidates who filed.
That comes from our most recent school board election analysis. South Dakota is one of the 10 states where we are providing comprehensive school board election coverage this year.
South Dakota’s school board elections are officially nonpartisan, meaning candidates appear on the ballot without party labels. But we used the state’s voter registration file to match every school board candidate with a party, giving us full partisan data across the state.
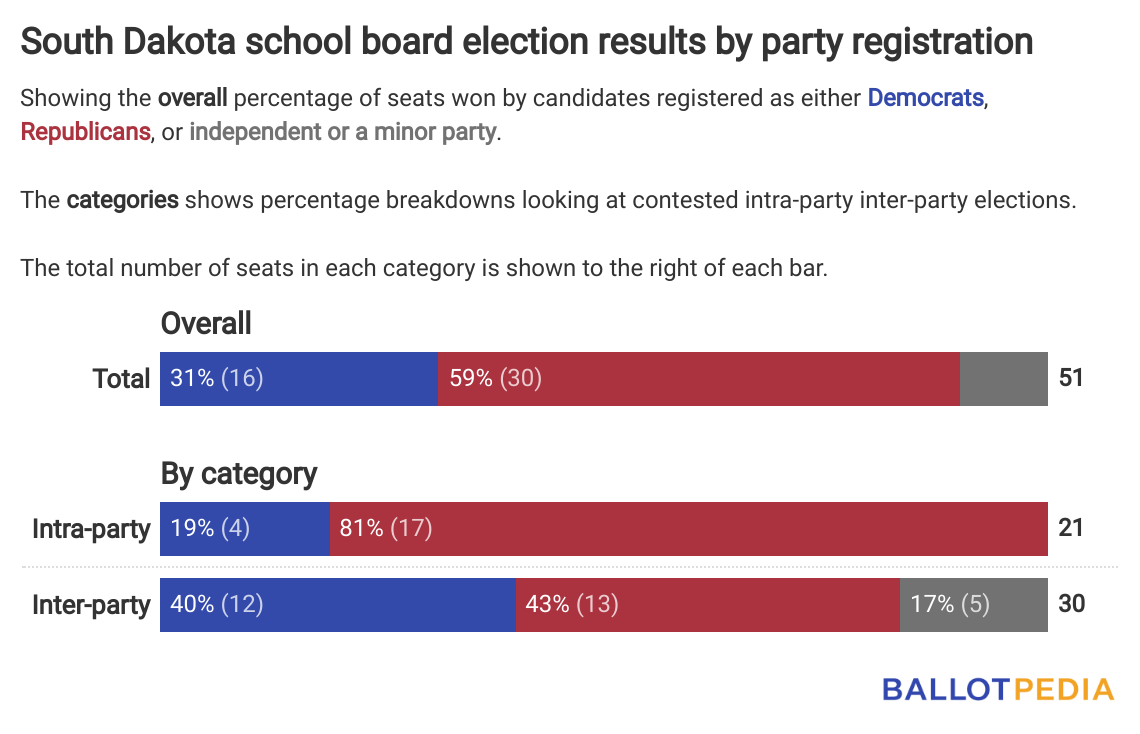
Registered Republicans won 30 of the 51 contested school board seats up for election in South Dakota this year. Registered Democrats won 16, and independent or minor party candidates won five.
Worth noting: a person’s party registration status does not necessarily dictate their political beliefs.
Still, this level of research can provide additional insights into school board elections.
Here’s what we found:
- After 117 canceled elections, 32 districts held elections for 51 of the state’s 853 school board seats.
- Twenty-one of those contested elections were intra-party (41%), meaning they included candidates registered with the same political party.
- The remaining 30 were inter-party (59%), meaning they included candidates registered with different political parties.
The chart below shows the overall total of contested elections in terms of seats won by party registration status as well as breakdowns between these different categories of election types:
With voter registration information, we were able to calculate the partisan balance of every school district in the state. You can find that info here.
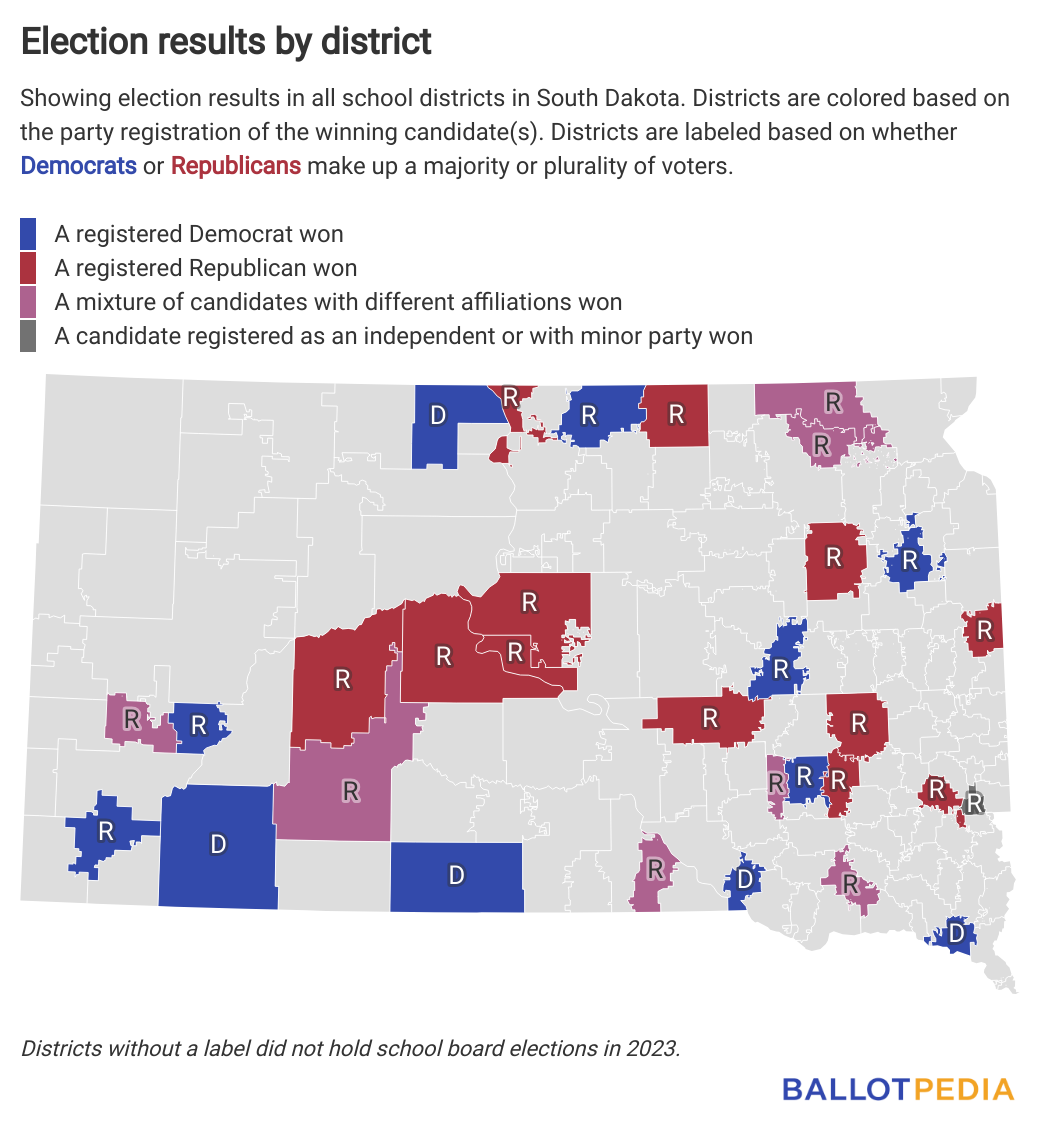
Of the 16 registered Democrats who won, six won in Democratic school districts – those where Democrats make up a majority or plurality of voters. Ten won in Republican districts.
All 30 Republicans and five independent or minor party winners won in Republican districts.
The map below shows South Dakota's contested school board elections. The colors indicate the party registration of the candidate, or candidates, who won there. Each district is further labeled based on whether it is a Democratic (D) or Republican (R) district:
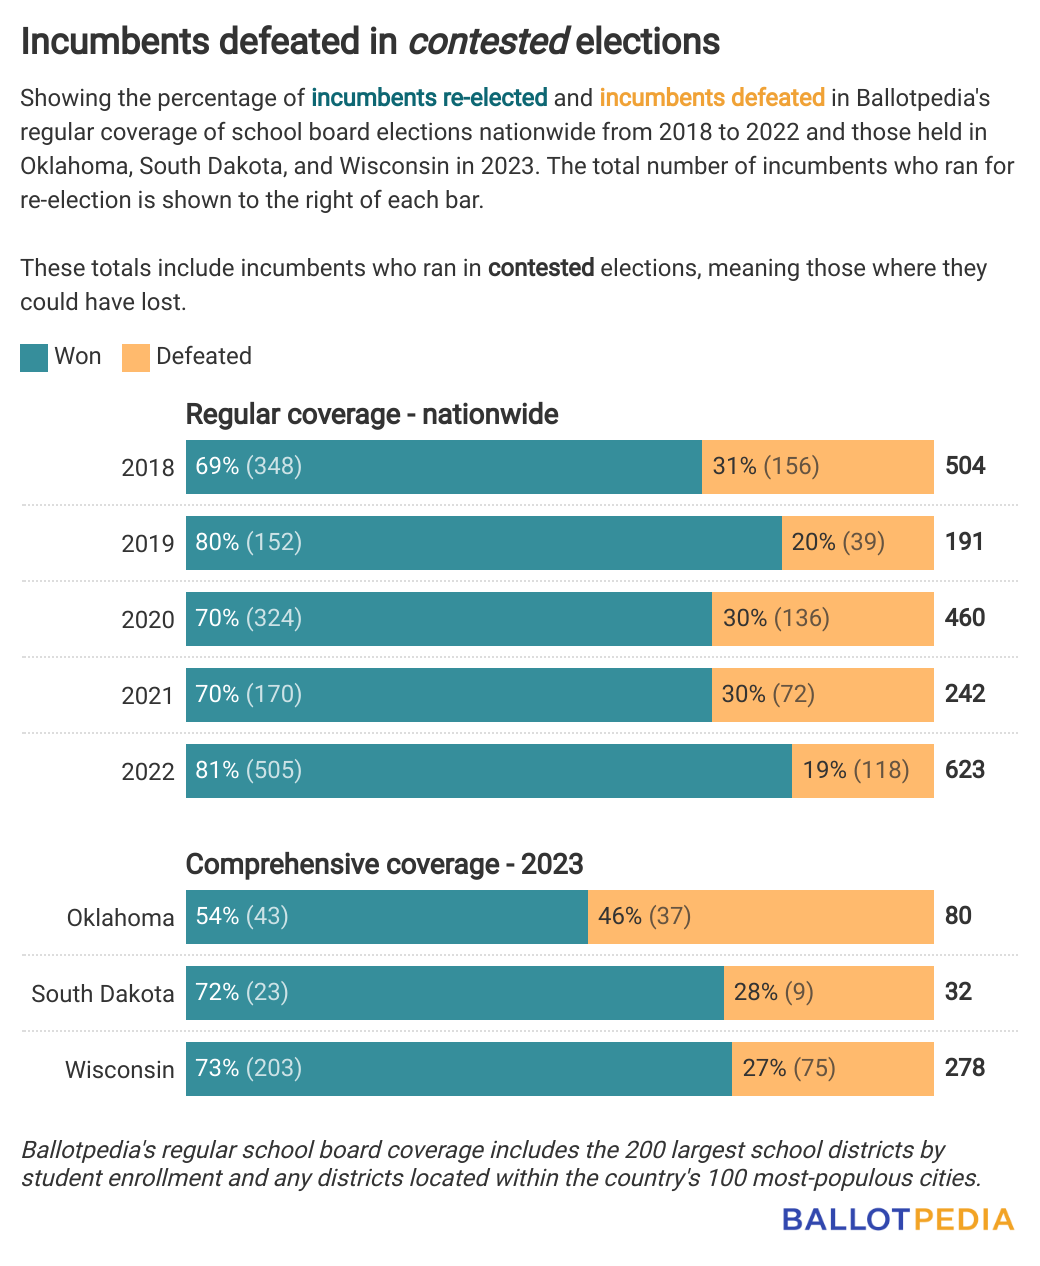
Beyond who won, we also looked at who lost in these elections, namely the number of incumbents defeated.
Of the 32 incumbents who ran for re-election in contested races, 72% won, and 28% lost. By comparison, between 2018 and 2022, we found that 26% of school board incumbents lost in contested elections nationwide.
Our report in South Dakota follows two other reports in Oklahoma and Wisconsin, which held their school board elections earlier this year.
Similar to South Dakota, in Wisconsin, we found that 27% of incumbents in contested elections lost. But in Oklahoma, that contested loss rate was much higher: 46% of all incumbents in contested elections lost there this year.
Use the link below to explore our research into South Dakota’s school board election, including open seats, student-to-teacher ratios, and endorsements from outside groups and individuals.
City council candidates complete Ballotpedia’s Candidate Connection Survey
If you’re a regular reader of this newsletter, then you know about our Candidate Connection survey. The survey allows voters to hear directly from candidates about what motivates them and their priorities. In races where all candidates completed the survey, voters get a unique opportunity to compare and contrast the candidates’ backgrounds, objectives, and experiences.
All the candidates in two city council elections this fall—one in Nashville (Tenn.) and one in Tucson (Ariz.)—completed Ballotpedia’s Candidate Connection Survey. Are you a candidate for office interested in helping voters understand you better? Click here to take our survey.
The general runoff election for Nashville Metro Council District 11 will take place on Sept. 14. Jeff Eslick said his three goals while in office would be: “The Safety of Nashville, Nashville’s Growth Management, and The Growing Number of Encampments.” Eric Patton said his three priorities would be “Schools, Services, and Support for Small Businesses.” In the Aug. 3 general election, Eslick received 38.2 percent of the vote and Patton received 36.3 percent.
The general election for Tucson City Council Ward 1 will take place on Nov. 7. Lane Santa Cruz (D) highlighted “Housing, Transportation & Mobility, and Workforce Development” as key goals. Victoria Lem (R) said her priorities were “Reduce Crime, Rebuild Our Roads, and Economic Responsibility.” Santa Cruz, the Ward 1 incumbent, won election in 2019. All three candidates in Ward 2—Paul Cunningham (D), Ernie Shack (R), and M. Pendleton Spicer (L)—have already completed our survey.
Click one of the candidate links above to read their full answers to our survey. We ask all federal, state, and local candidates with profiles on Ballotpedia to complete a survey and share what motivates them on political and personal levels. Ask the candidates in your area to fill out the survey.