


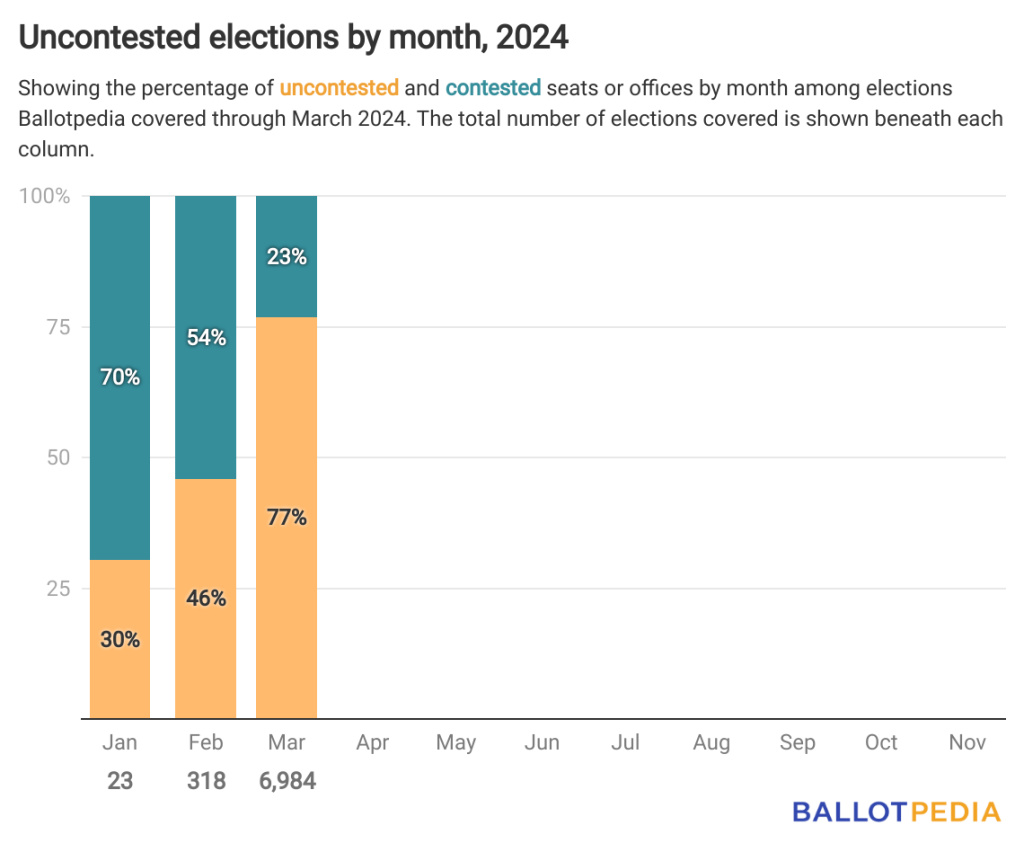
Throughout March, Ballotpedia covered 6,984 elections in 26 states, 77% of which were uncontested.
That’s up from February when 46% of the 318 covered were uncontested.
Ballotpedia defines an uncontested election as one where the number of candidates running is less than or equal to the number of seats up for election. This analysis does not account for write-in candidates.
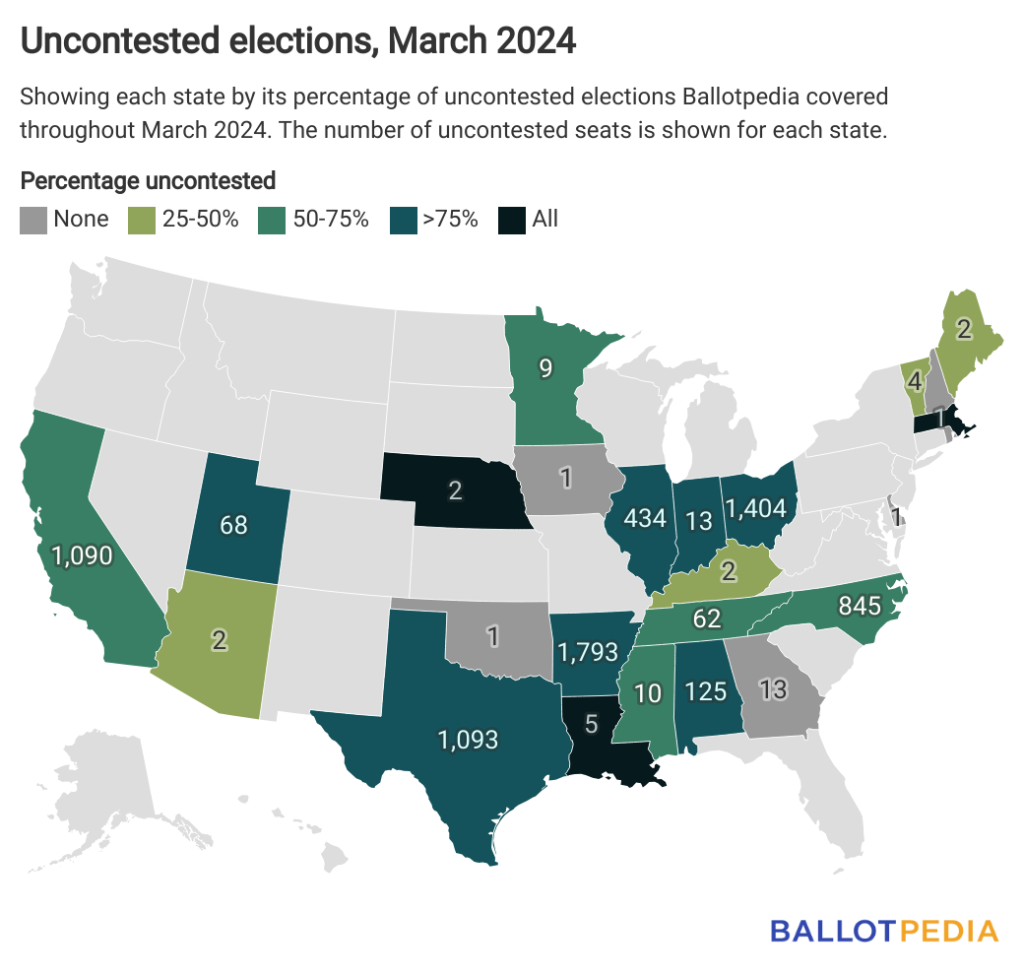
Of the 26 states where Ballotpedia covered elections last month, four—Arkansas, California, Ohio, and Texas—held more than 1,000.
Among those four states, Arkansas and Ohio had the highest rate of uncontested elections, tied at 84%, while California had the lowest at 66%.
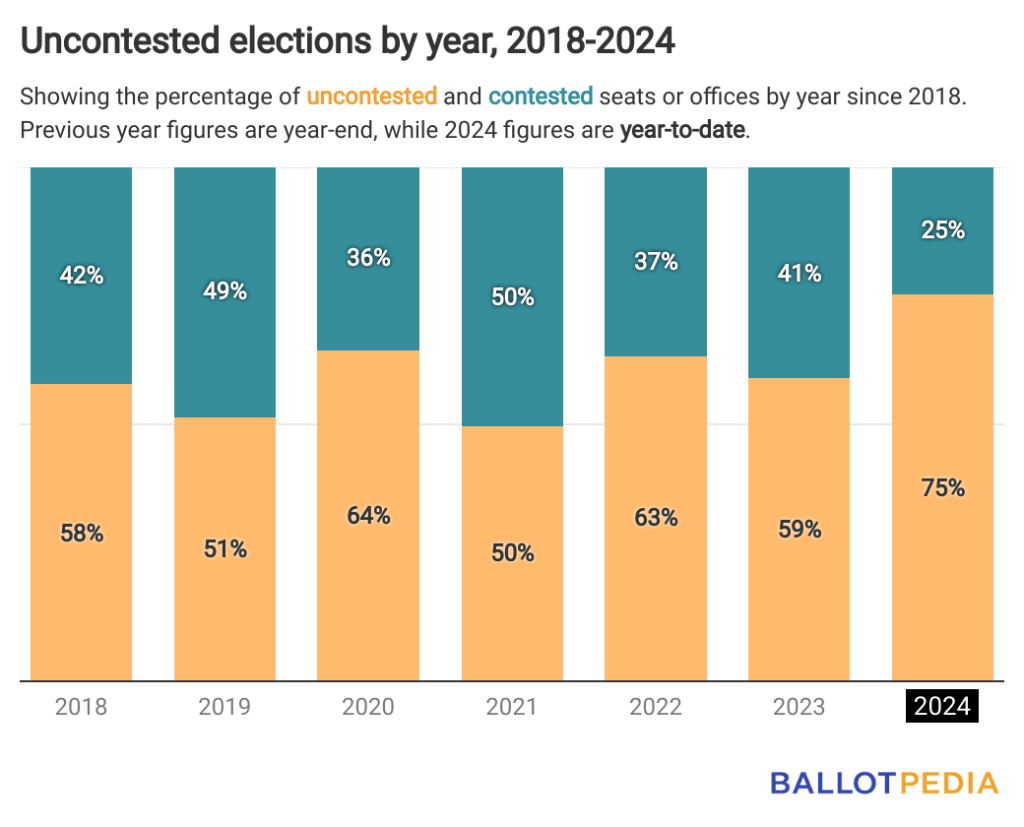
March’s rate of uncontested elections was greater than the 58% average rate identified between 2018 and 2023.
For comparison, since 2018, each year has had more elections uncontested than contested except for one, in 2021, when 50.4% of the elections Ballotpedia covered were contested.
Click on the link below to learn more about uncontested elections nationwide last month and in all previous months through 2024.