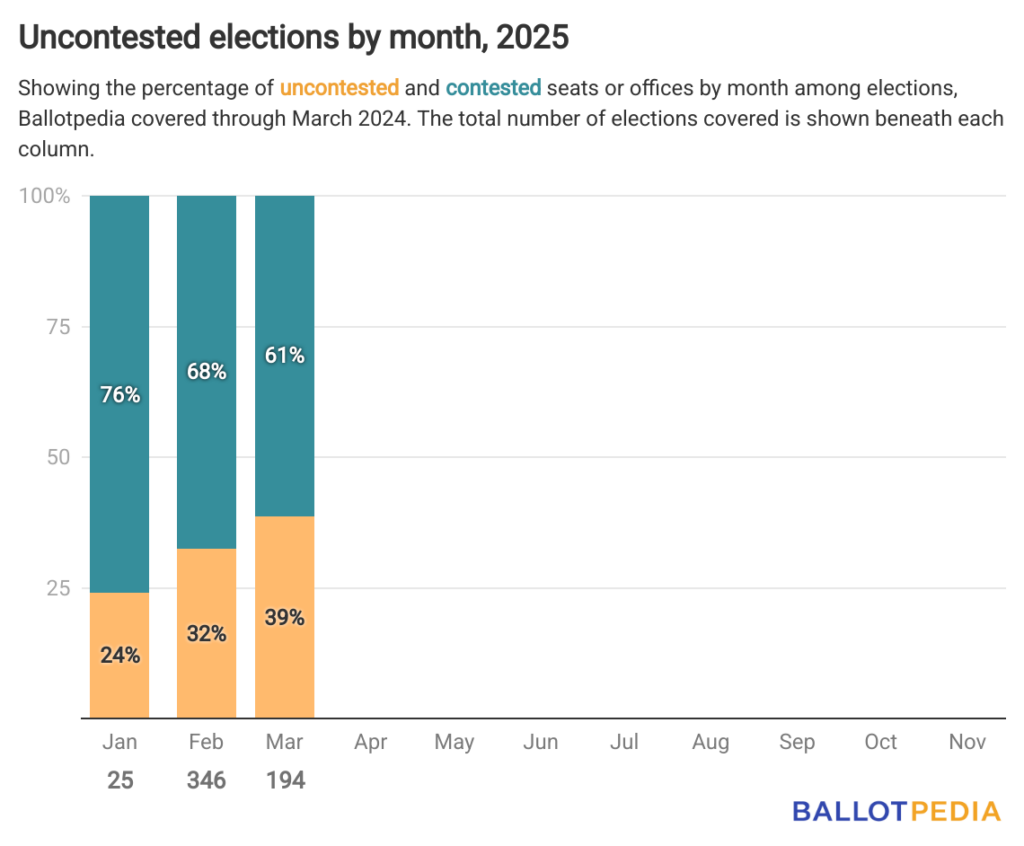
Throughout March, Ballotpedia covered 194 elections in 22 states, 39% of which were uncontested.
That’s up from February when 32% of the 345 covered were uncontested.

Ballotpedia defines an uncontested election as one where the number of candidates running is less than or equal to the number of seats up for election. This analysis does not account for write-in candidates.
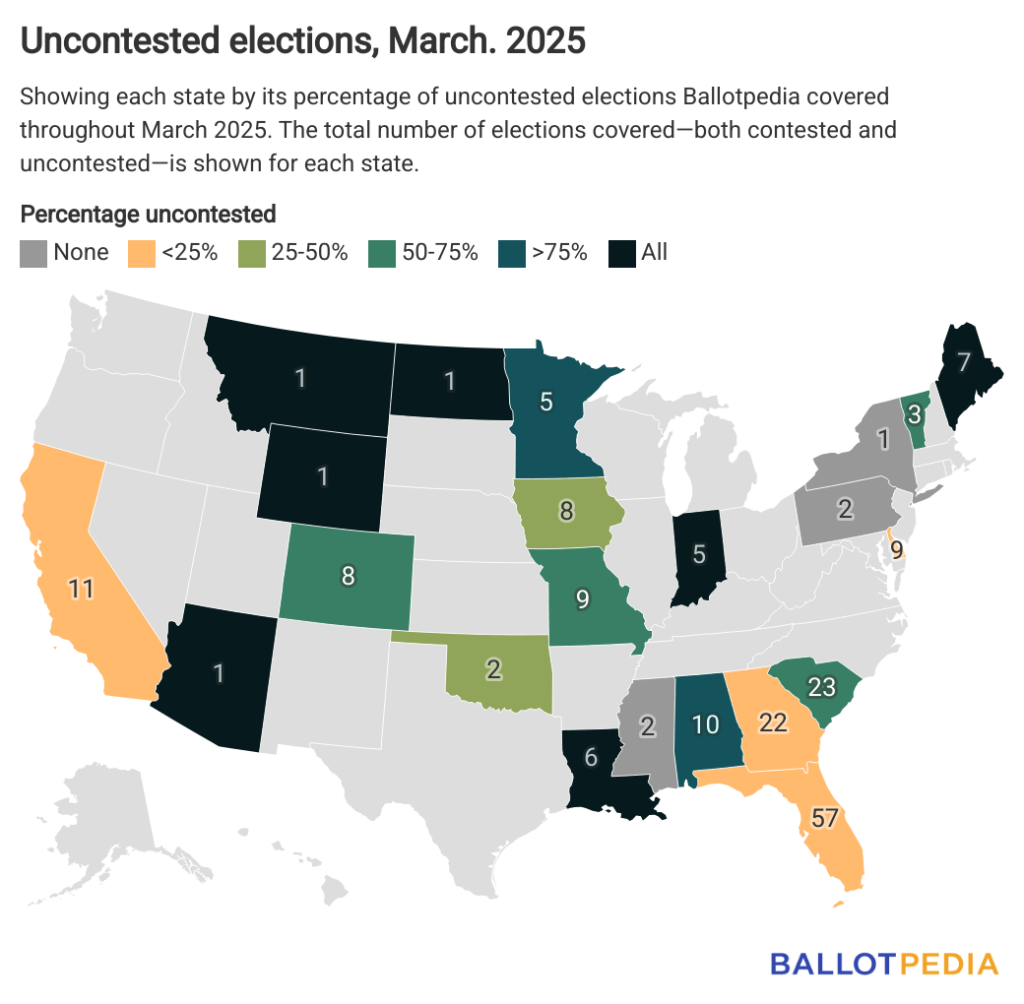
Several states experienced 100% uncontested elections, including Arizona, Indiana, Louisiana, Maine, Montana, North Dakota, and Wyoming. However, it should be noted that sample sizes were not significant; each state held less than ten elections.
In addition to those with fully uncontested elections, several other states had more than 50% of their races uncontested: Minnesota and Alabama reported 80% of their elections as uncontested, while Vermont (67%), Colorado (63%), Missouri (56%), and South Carolina (52%) also recorded a significant proportion of uncontested races.
Conversely, Ballotpedia recorded some states reported relatively low percentages of uncontested elections. California (9%), Georgia (9%), Delaware (11%), and Florida (18%) exhibited a majority of contested elections. Notably, Mississippi, New York, and Pennsylvania recorded no uncontested elections.
The highest number of elections were covered in Florida, Georgia, and South Carolina. Florida had the highest number of total elections (57), with 10 uncontested races, resulting in an 18% uncontested rate. South Carolina followed with 23 total elections, of which 12 were uncontested (52% uncontested rate). Georgia conducted 22 elections, with only two uncontested (9% uncontested rate).

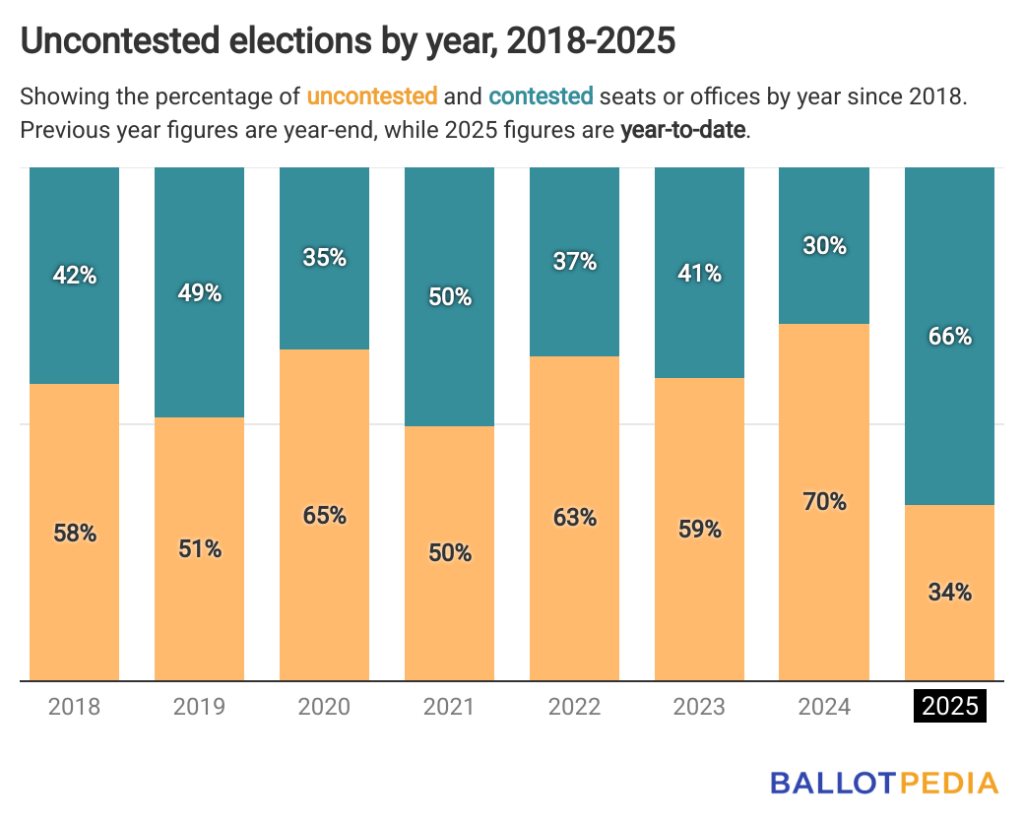
March’s rate of uncontested elections was less than the 64% average rate identified between 2018 and 2024.
It also brings the year-to-date rate of uncontested elections to 34%.
For comparison, since 2018, each year has had more uncontested than contested elections except for one, in 2021, when 50.4% of the elections Ballotpedia covered were contested.


