Democrats’ state legislative special election gains since January 2025 increased to 12 after the party gained control of two Florida seats on March 24, 2026.
Emily Gregory (D) won a March 24 special election for Florida House District 87, winning the race by 2.4 percentage points in a district Republicans won by 19 percentage points in 2024. Brian Nathan (D) won a March 24 special election for Florida Senate District 14 by 0.6 percentage points. Republicans won the 2024 election for the seat by 9.2 percentage points.
In the House District 87 election, the Democratic vote total was 44% of the party’s vote total in the district’s 2024 regular election. For Republicans, that number was 28%. In Senate District 14, the Democratic vote total was 46% of the party’s vote total in the district’s 2022 regular election, and Republicans’ was 38%.
In total, Democrats have gained 12 legislative seats nationwide through special elections since January 2025. Republicans have gained no seats from special legislative elections in that timeframe.
Here’s a closer look at voter turnout retention and margin shifts in the special state legislative elections since January 2025.
Vote total retention
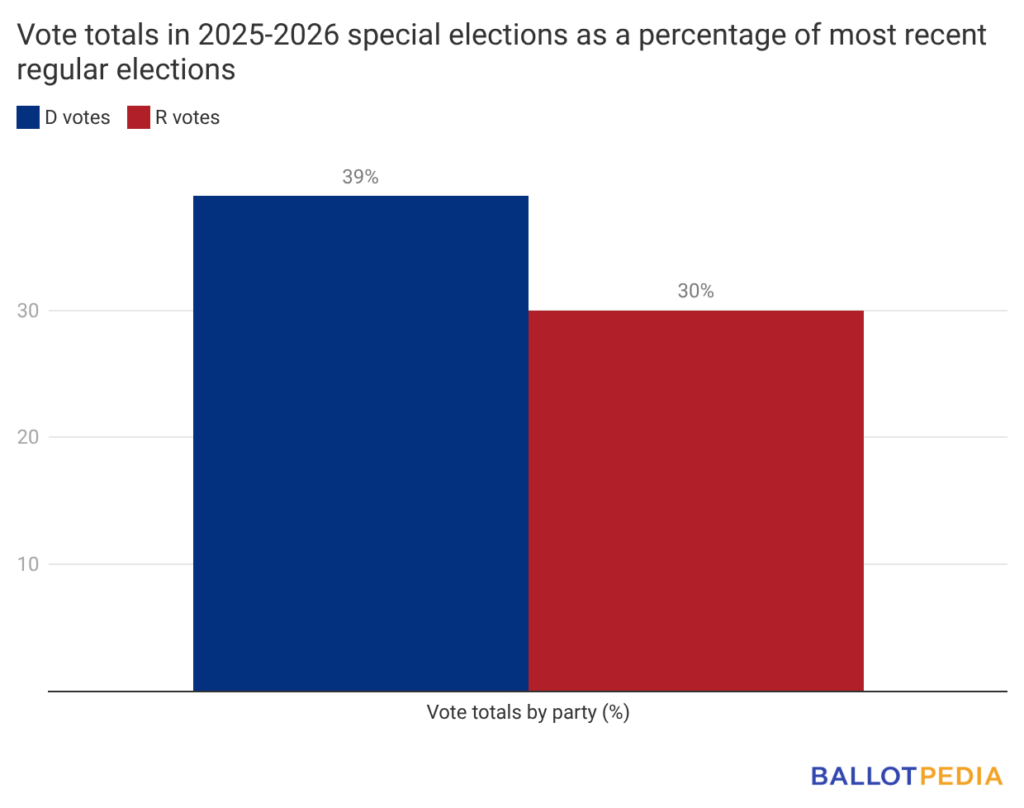
In special state legislative elections since January 2025, Democratic candidates received nine percentage points more of their party’s vote total from the previous election than Republicans.
There were 83 districts where a Democrat had appeared on the special election ballot and on the previous regular general election ballot. On average in those districts, Democratic vote totals in the special elections were 39% of the party’s vote totals in the previous regular general elections.
There were 78 districts where a Republican had appeared on the special election ballot and on the previous regular general election ballot. On average, Republican vote totals in the special elections were 30% of the party’s vote totals in the previous regular general elections.
Margin of victory shifts
There were 57 districts where both the special election and the most recent general election had candidates from both major parties. Democrats won 42 of those special elections, and Republicans won 15. Democrats won 33 of the previous general elections in those districts, and Republicans won 24.
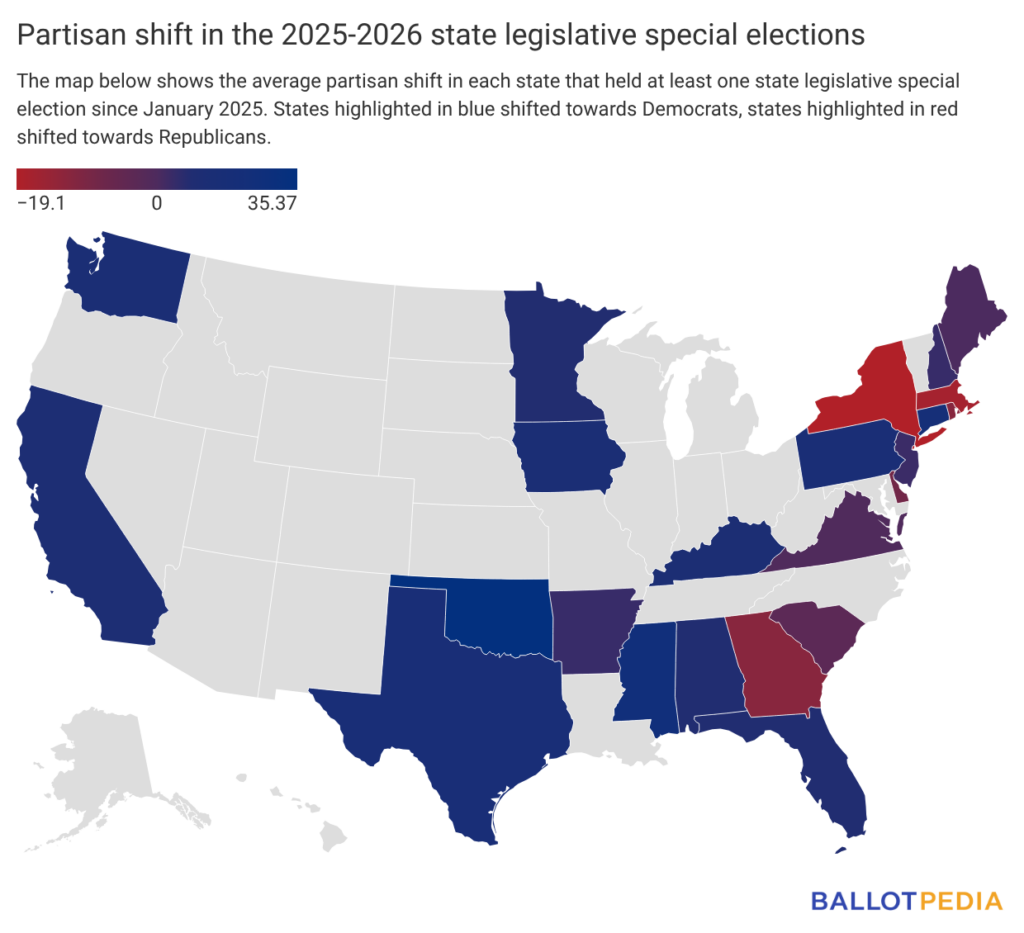
Forty-five of those districts shifted toward Democrats in the special election compared to the previous election, and 12 shifted toward Republicans. Overall, the average shift across all 57 districts was 5.3 percentage points toward Democrats.
The map below shows the average partisan shift in each state that had at least one state legislative special election since January 2025. The data below include all 106 special general elections that had been called by March 27.