

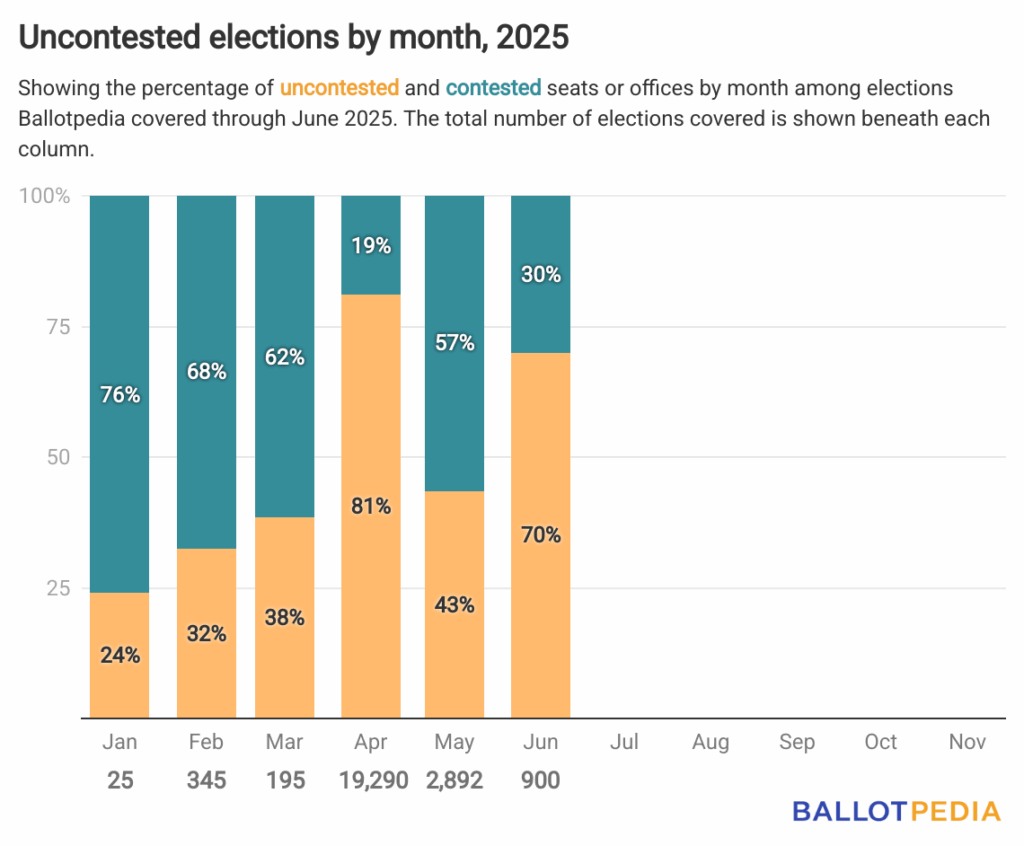
Throughout June, Ballotpedia covered 900 elections in 20 states, 70% of which were uncontested.
That’s up from May, when 43% of the 2,892 covered were uncontested.
Ballotpedia defines an uncontested election as one where the number of candidates running is less than or equal to the number of seats up for election. This analysis does not account for write-in candidates.
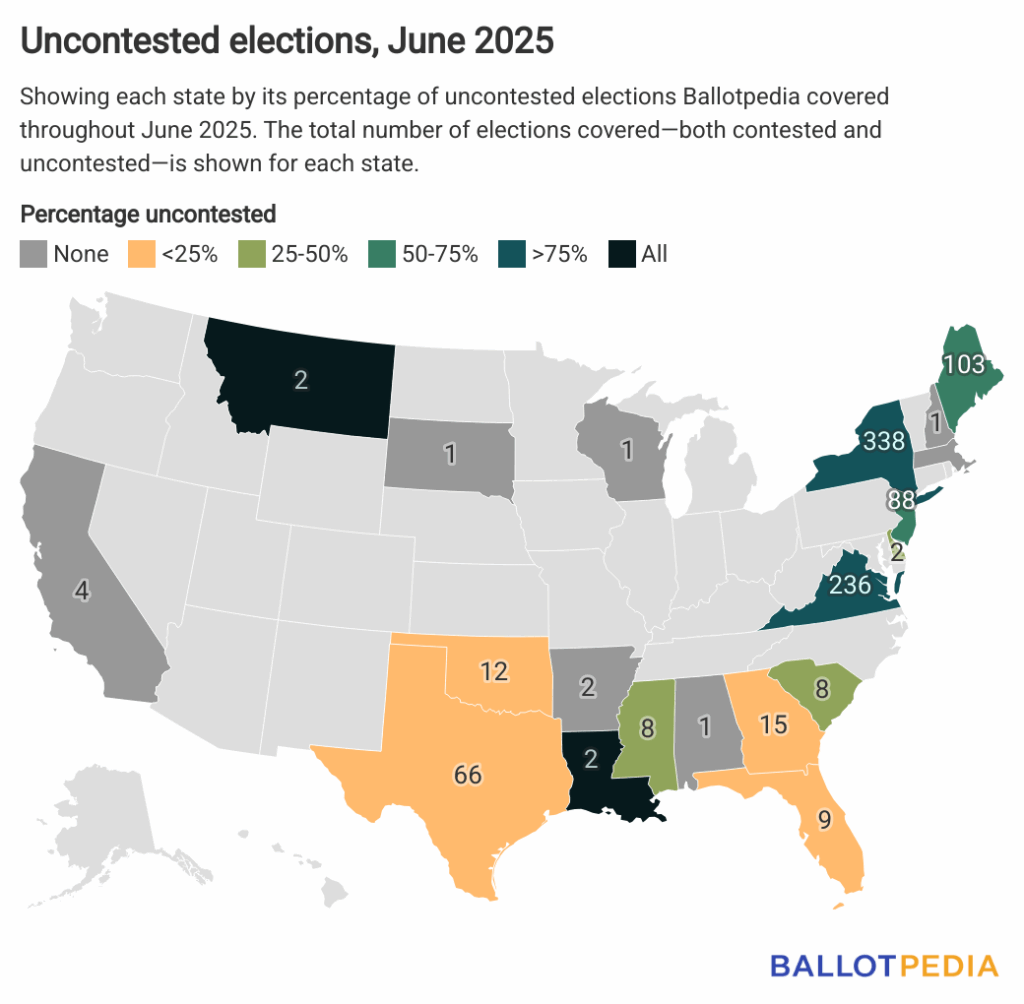
States with the highest percentages of uncontested races included Louisiana (100%), Montana (100%), Virginia (90%), and New York (85%). Other states with more than half of the races uncontested included New Jersey (64%), Maine (55%), and Delaware (50%).
States with moderate proportions of uncontested races included South Carolina (38%), Mississippi (25%), Florida (22%), Georgia (13%), Oklahoma (8%), and Texas (2%).
Seven states in the dataset—Alabama, Arkansas, California, Massachusetts, New Hampshire, South Dakota, and Wisconsin—had no uncontested races among those covered. However, it should be noted that fewer than five races were covered in each state.
The number of races covered varied by state, ranging from one race to more than 300. The highest total counts of races covered were in New York (338 races) and Virginia (236 races). Other states with more than 80 races covered included Maine (103 races) and New Jersey (88 races).
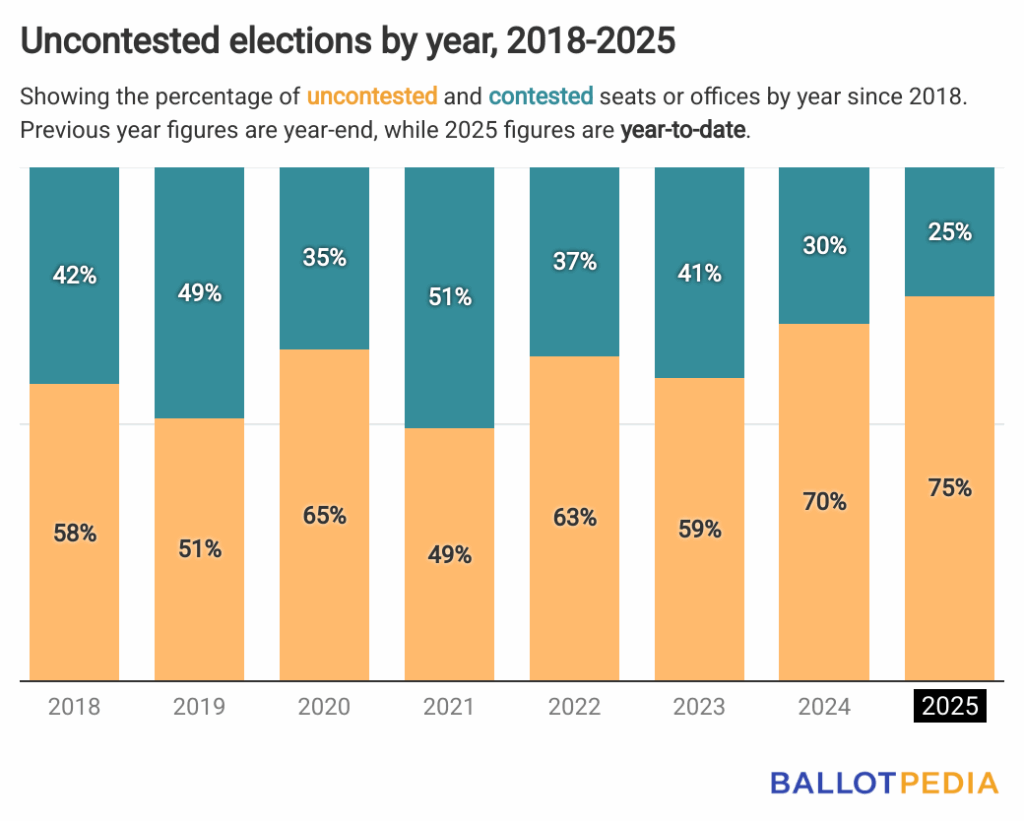
June’s rate of uncontested elections was greater than the 64% average rate identified between 2018 and 2024.
It also brings the year-to-date rate of uncontested elections to 75%.
For comparison, since 2018, each year has had more uncontested than contested elections, except for one, in 2021, when 50.4% of the elections Ballotpedia covered were contested.
Click on the link below to learn more about uncontested elections nationwide last month and in all previous months through 2025.