

Welcome to the Friday, Oct. 17, Brew.
By: Briana Ryan
Here’s what’s in store for you as you start your day:
- This year's recall success rate is 10%—below the 15-year average
- Bringing it all together: Why robust information matters, part 1, by Leslie Graves, Ballotpedia Founder and CEO
- One new ballot measure certified in California for 2026
This year's recall success rate is 10%—below the 15-year average
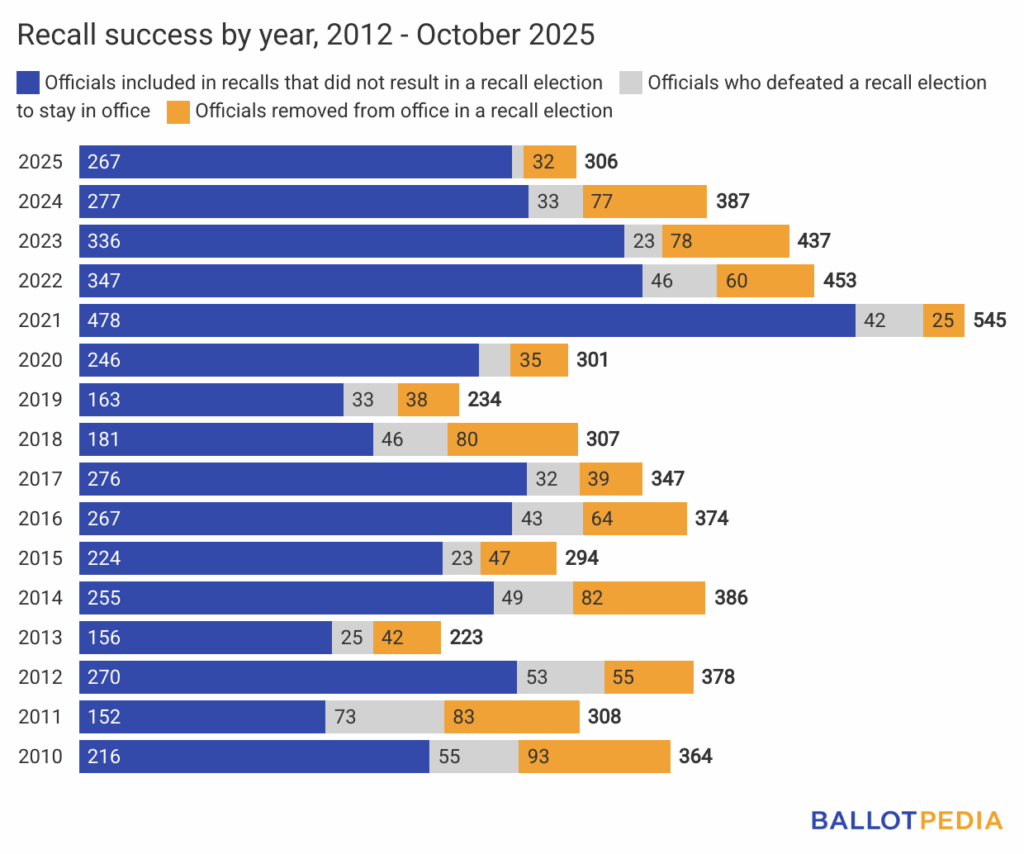
As of Oct. 10, voters have removed 32 of the 306 elected officials named in recall efforts this year. That's a success rate of 10%. From 2010 to 2024, the average recall success rate was 17%.
The highest success rate occurred in 2011, when voters removed 83 of the 308 officials targeted for recalls from office, a success rate of 27%.
The lowest success rate occurred in 2021, when voters removed 25 of the 545 officials targeted for recalls from office, a success rate of 5%.
A political recall is the process by which citizens can remove elected officials from office before the end of their term. This process typically includes recall organizers circulating petitions, election officials evaluating petition signatures, and a recall vote if organizers collect enough valid signatures. The details of the recall process vary from state to state.
As of Oct. 10, city council members had the most recall petitions filed against them among all office types this year. School board members came in second with 39 petitions, and state legislators were third with 37.
As of Oct. 10, California had the most officials named in recall petitions this year at 39. Minnesota came in second with 35 officials, and Colorado was third with 33.
When adjusted for state population using the U.S. Census Bureau's July 2024 population estimates, Alaska became the recall leader with 1.35 recalls per 100,000 residents. Rhode Island (0.81 recalls per 100,000 residents) came in second, and Minnesota (0.6 recalls per 100,000 residents) came in third.
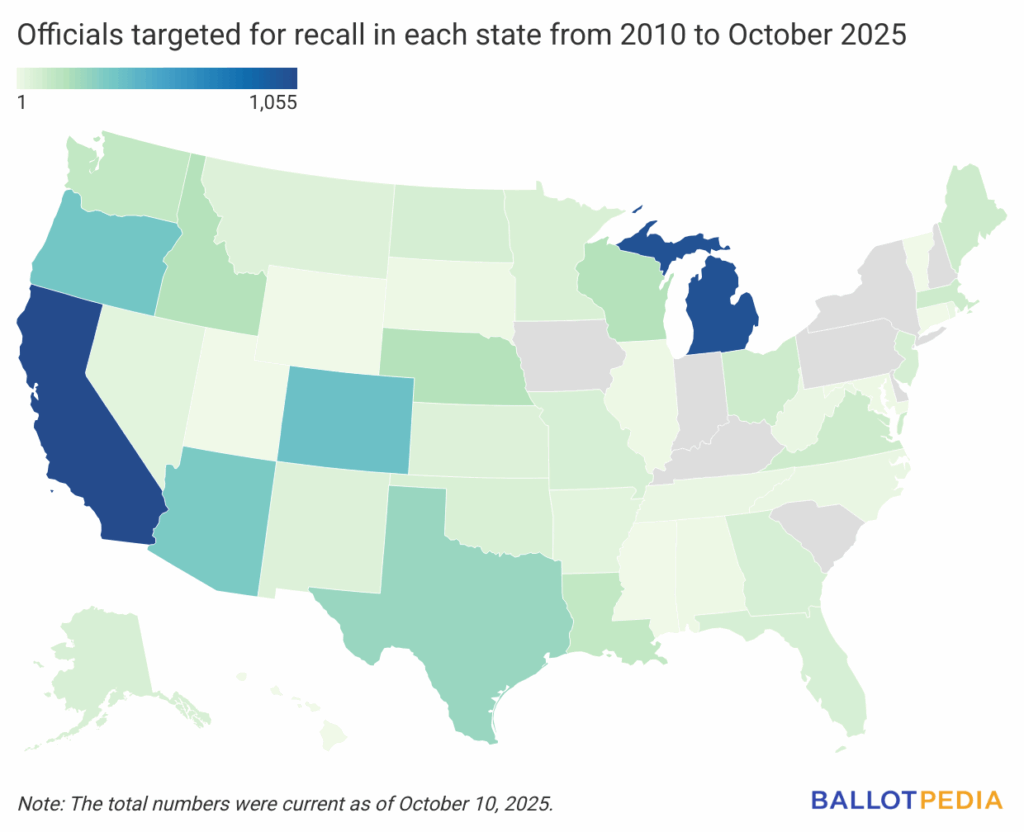
From 2010 to 2024, California had the most officials included in recall efforts, with 1,055, or 19% of all the recalls we followed during that period. Michigan came in second, with 1,013 (18%). Colorado was third, with 394 (7%).
From 2010 to 2024, city council members had the most recall petitions filed against them, except in 2021, when school board members had the most. School board members had the second-most recall petitions filed against them in every year except 2021, when they had the most, and 2017, when they ranked third after city council members and mayors.
Click here to read more about political recall efforts since 2010.
Bringing it all together: Why robust information matters, part 1

Over the last few weeks, I’ve written about the sources we use to provide voters with robust information about the candidates on their ballots. Why is robust information such a big deal? Because our elections are too important to leave to guesswork.
There’s no reason why any voter should ever have to look at the list of candidates on their ballot and say, “I don’t know anything about this person.” That’s doubly true in an era when we can access more and more information at faster and faster speeds, and get all of it delivered to the palms of our hands.
Our national experiment in self-governance succeeds when voters have more information about candidates — not only their names and the offices they seek, but also what they stand for, how they think, and what they hope to accomplish in our names. Often, even having just one of those other indicators can go a long way toward giving voters a better understanding of who their candidates are.
Right now, however, too many voters in far too many elections don’t have anything close to robust information about their candidates. Ballotpedia is determined to change that as much as we possibly can — because it’s the right thing to do for our country.
Let’s do a quick review of our five go-to sources that can help us build a robust information profile for a candidate:
- A completed Ballotpedia Candidate Connection Survey;
- A listing of endorsements a candidate may have received;
- Links to any pledges the candidate may have signed in support of or opposition to specific policies or actions;
- Links to scorecards that advocacy groups have compiled on a candidate's voting record or public pronouncements;
- Links to and samples of primary sources indicating a candidate’s campaign themes.
The most robust candidate profile we could provide would include information from all five of these categories. This is the information we can provide for congressional and presidential candidates. That’s no surprise considering the vast resources — from candidates themselves, the media, interest groups, and more — devoted to covering just about every aspect of national politics.
We can get many, if not most, of the same data for candidates seeking statewide office, state legislative seats, or mayoral and school board offices in the nation’s largest cities and counties. Like their national counterparts, candidates at this level generally run in a media-rich environment where it’s essential for them to share as much information about themselves as possible.
The further down the ballot we go, however, the more difficult it is to provide information from even one of the five major sources noted above. That’s where the real challenges begin, because it’s here, at the local level, with its more than 500,000 elected offices, that voters need robust information — even if that means adding data to a candidate profile from just one of our five major sources.
Even one item — like an endorsement or a completed survey — can help answer the question, “Who is this person on my ballot?”
The challenges aren’t just in the volume of candidates, though that’s a very real thing. Next week, I’ll outline some of the others we face and how we plan to meet them.
One new ballot measure certified in California for 2026
While the number of statewide ballot measures—30—for this year is finalized, the total for next year will continue to increase until September 2026.
As of Oct. 14, 56 measures have been certified for the 2026 ballots. The most recent certification was on Oct. 2, when California Gov. Gavin Newsom (D) signed legislation for the Allow Public Financing of Election Campaigns Measure. The measure would repeal the state's ban on public financing of campaigns, enacted in 1988, and allow the state and local governments to create programs that provide candidates with public funds.
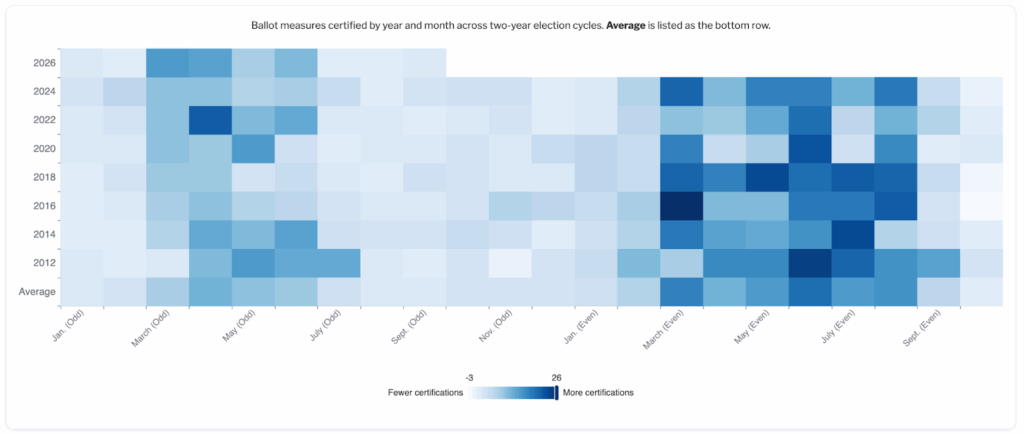
The number of measures for the 2026 ballots—56—is above the even-year average of 48. Since 2012, an average of two measures have been certified in October of the year before the election.
The following heatmap shows the number of statewide ballot measures certified each month from 2012 through 2026, grouped by two-year election cycles leading up to even-numbered general elections. It highlights both the volume and timing of certifications. The bottom row displays the monthly averages across all years.
The next signature deadlines for indirect initiated state statutes are Nov. 15 in Utah and Nov. 19 in Massachusetts.
Click here for a deep dive into the measures certified for the 2026 ballot.