


Ballotpedia has been analyzing the 206 Pivot Counties that voted for Barack Obama (D) in 2008 and 2012 and Donald Trump (R) in 2016. This year, we have introduced two new categories: Retained Pivot Counties, which voted for Trump again in 2020, and Boomerang Pivot Counties, which voted for Joe Biden (D).
Based on unofficial results that are subject to change, Ballotpedia has identified 179 Retained Pivot Counties and 25 Boomerang Pivot Counties.
A detailed look at two characteristics, population and educational attainment, shows that Retained Pivot Counties are, on average, less populous and have lower rates of high school graduation and bachelor’s degree attainment compared to Boomerang Pivot Counties.
Collectively, Pivot Counties make up 4.9% of the U.S. population at 16,070,734. The 179 Retained Pivot Counties make up 70.9% of that total and the 25 Boomerang Pivot Counties make up the remaining 29.1%.
The average population of a Retained Pivot County is 63,615 compared to 186,852 for a Boomerang Pivot County. The nationwide county population average is 104,435. Since the 2016 presidential election, the population of Retained Pivot Counties decreased an average of 0.1% while the population of Boomerang Pivot Counties increased 1.0%.
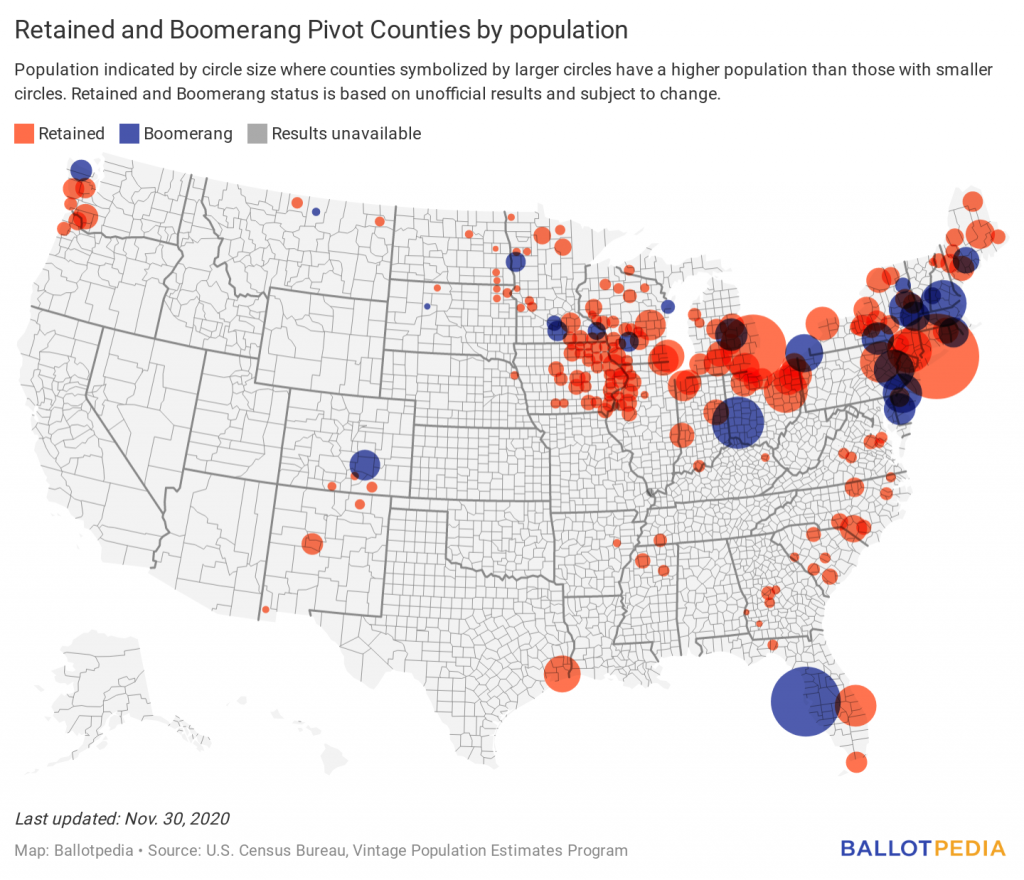
The map below shows all Retained and Boomerang Pivot Counties by population. Larger circles indicate more populous counties. The largest Retained Pivot County is Suffolk County, New York, with a population of 1,476,701. The largest Boomerang Pivot County is Pinellas County, Florida, with a population of 974,996.
For educational attainment, Ballotpedia examined high school graduation rates and bachelor’s degree attainment as a percentage of individuals 25 years and older. The table below highlights the averages of these demographics in 2020, 2016, and shows the change between those years.

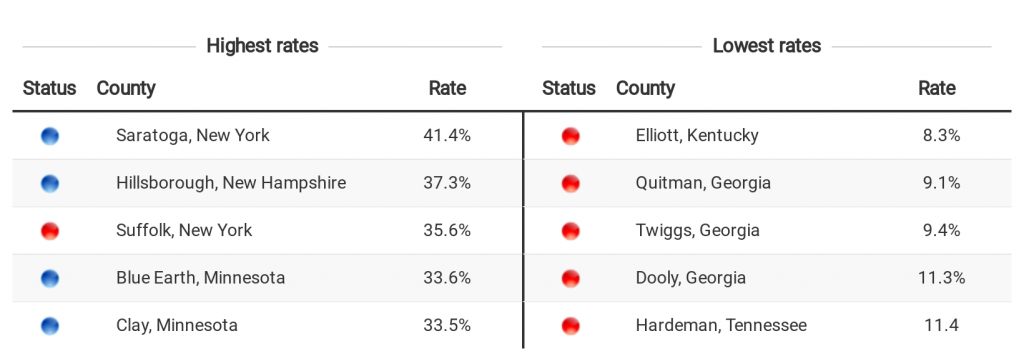
On average, Boomerang Pivot Counties have a higher rate of high school graduation than Retained Pivot Counties, but a majority of both types of counties exceed the national high school graduation rate. Ninety-two percent of Boomerang Pivot Counties (23) exceed the national rate compared to 68% of Retained Pivot Counties (122). The table below shows the counties with the five highest and lowest high school graduation rates. Red dots indicate a Retained Pivot County and blue dots indicate a Boomerang Pivot County:

Boomerang Pivot Counties also have a higher rate of bachelor’s degree attainment than Retained Pivot Counties on average. Thirty-two percent of Boomerang Pivot Counties (8) have above average attainment rates compared to 3% (5) of Retained Pivot Counties. The table below shows the counties with the five highest and lowest bachelor’s degree attainment rates:
To learn more about the demographics of these counties, click here.