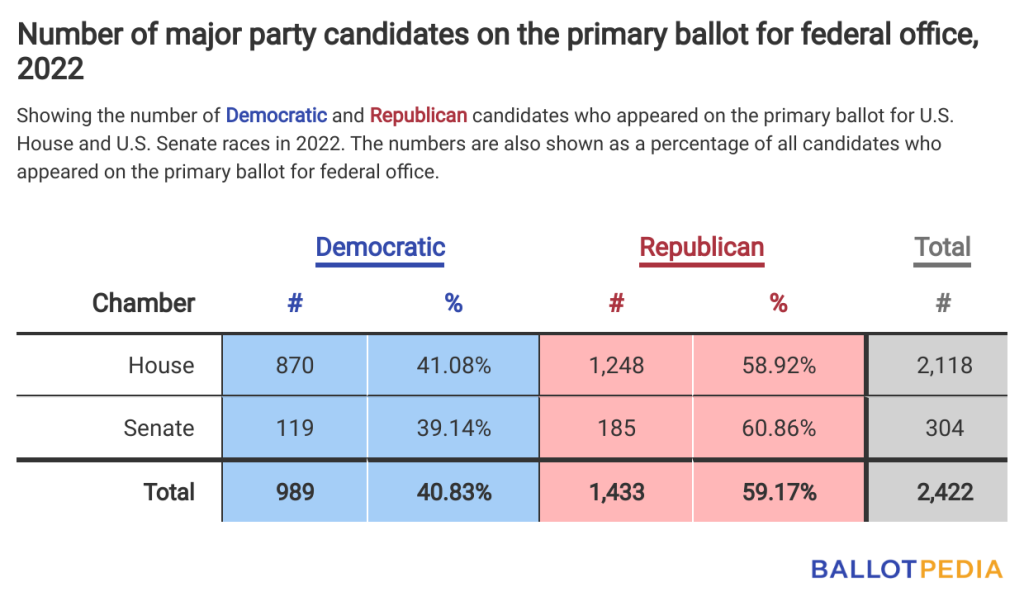
In 2022, 2,422 major party candidates appeared on the primary ballot for 474 seats in the U.S. Congress. The seats included 34 U.S. Senate seats, the seats of all 435 U.S. Representatives, and the seats of five of the six non-voting delegates to the U.S. House.
Of the 2,422 candidates who appeared on the primary ballot, 989, or 40.83%, were Democrats, and 1,433, or 59.17%, were Republicans.
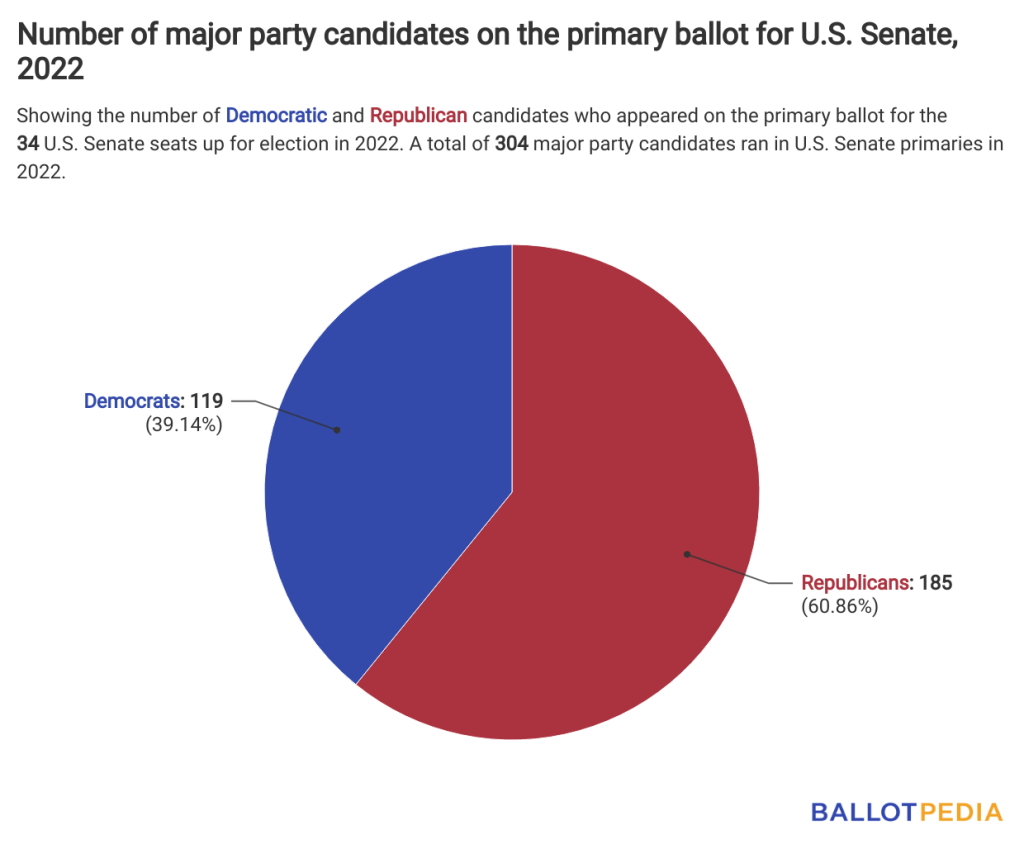
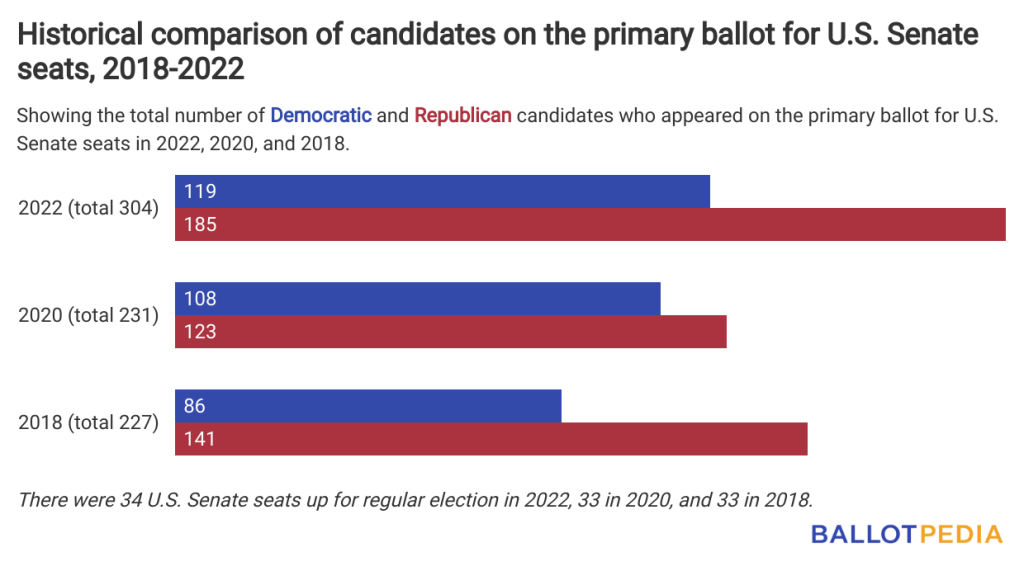
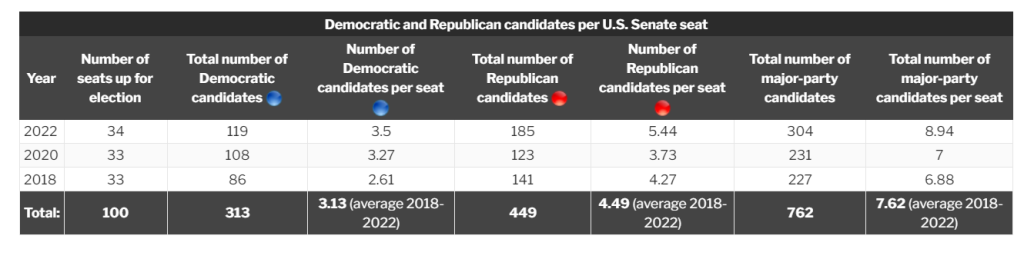
In the U.S. Senate:
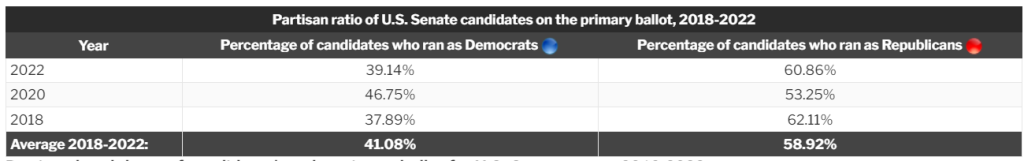
- There were 304 major party candidates on the primary ballot this year, including 119 Democrats, or 39.14% of all candidates who ran, and 185 Republicans, or 60.86% of all candidates who ran.
- The 119 Democrats who appeared on the primary ballot this year were 11 more than the 108 who appeared on the ballot in 2020 and 33 more than the 86 who appeared in 2018.
- The 185 Republicans who appeared on the ballot were 62 more than the 123 who appeared on the ballot in 2020 and 44 more than the 141 who appeared in 2018.
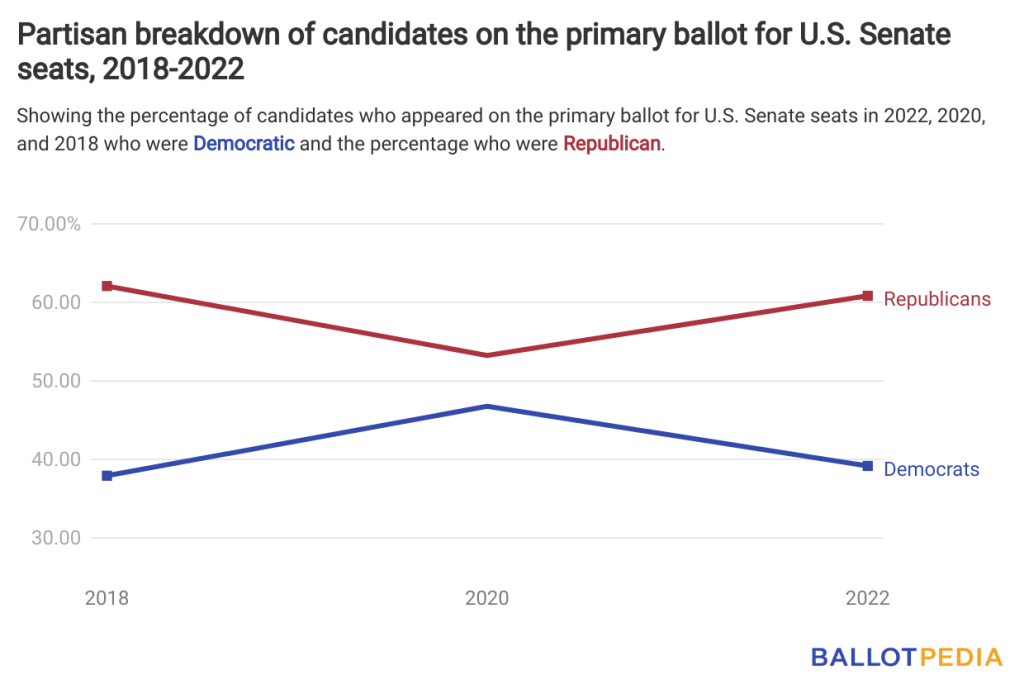
- The percentage of major party candidates this year who identified as Democrats was lower than in 2020, when 46.75% of major party candidates did, but higher than in 2018, when 37.89% did.
- Conversely, the percentage of major party candidates who identified as Republicans this year was higher than in 2020, when 53.25% did, but lower than in 2018, when 62.11% did.
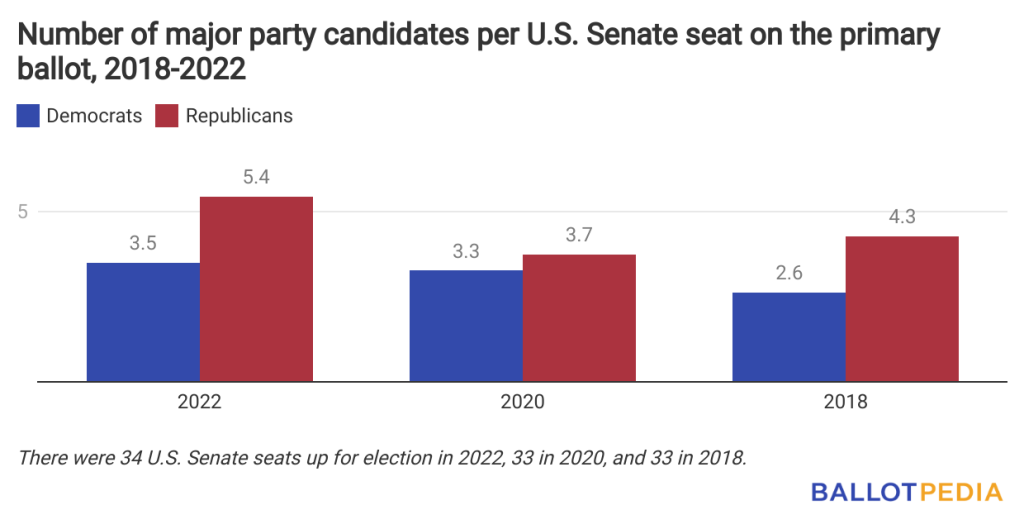
- There were 3.5 Democratic candidates on the ballot per U.S. Senate seat this year. That’s more than the 3.27 Democrats per seat who appeared on the ballot in 2020 and the 2.61 Democrats per seat who appeared in 2018.
- There were 5.44 Republican candidates on the ballot per U.S. Senate seat in 2022. That's more than the 3.73 Republicans per seat who appeared on the ballot in 2020 and the 4.27 Republicans per seat who appeared in 2018.
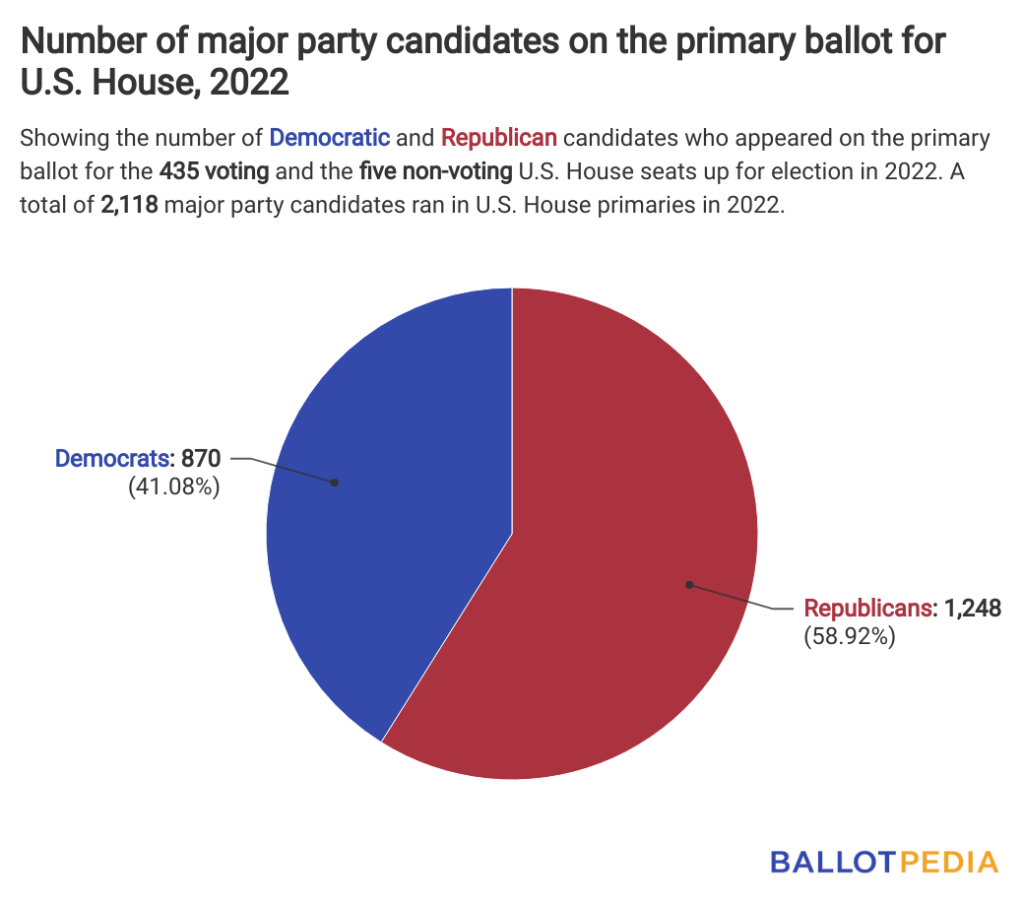
In the U.S. House:
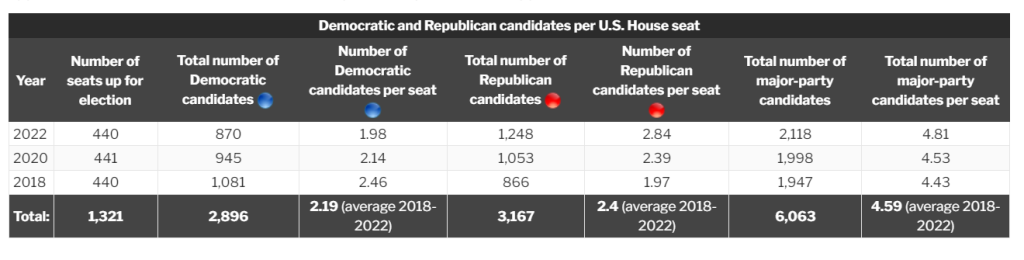
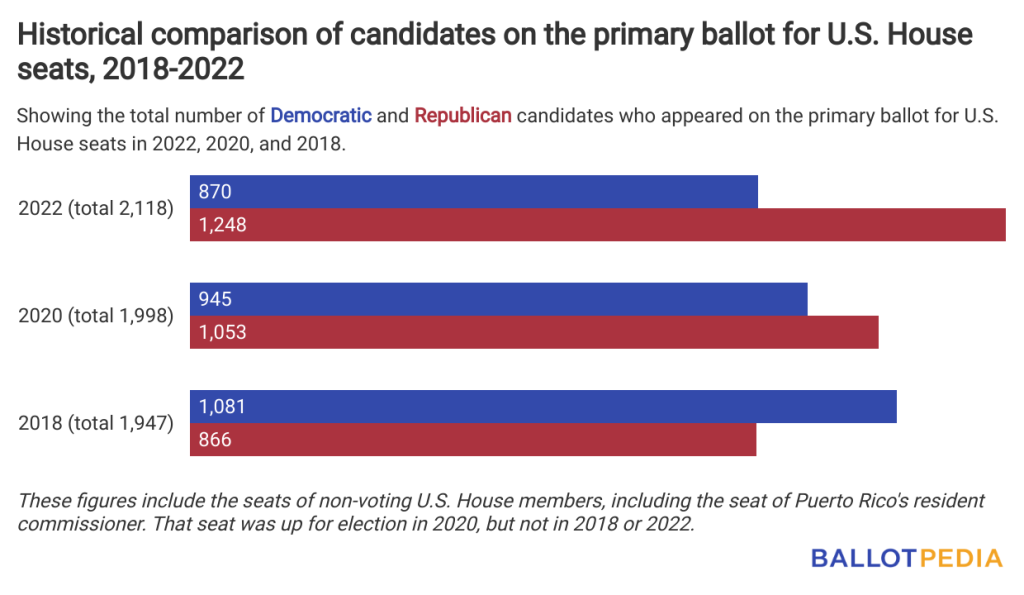
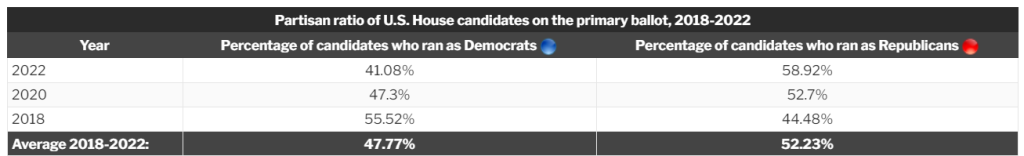
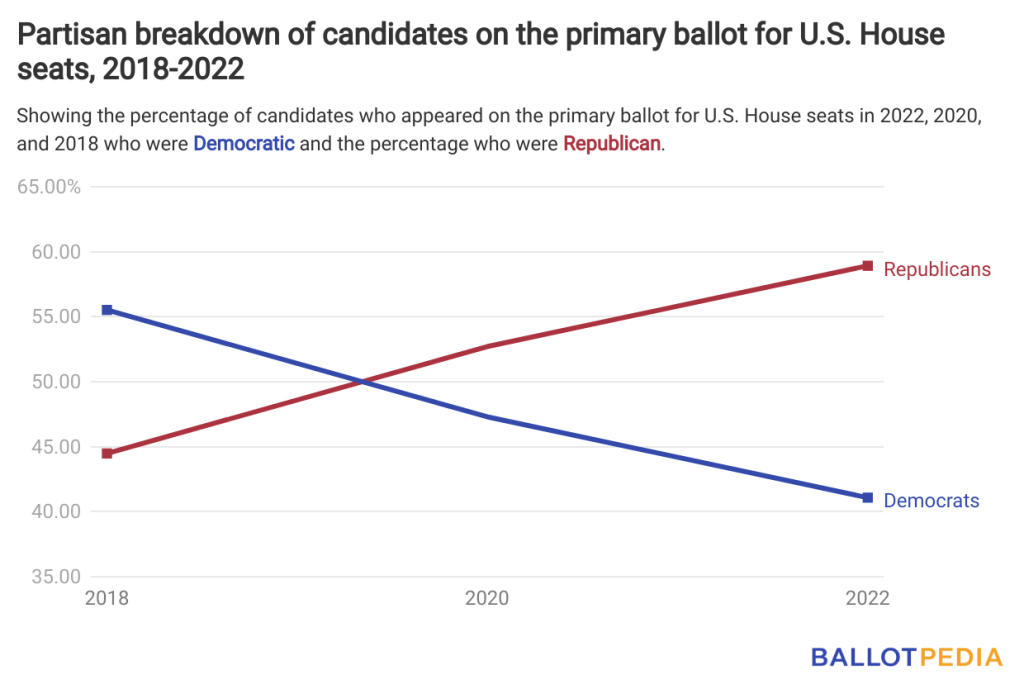
- There were 2,118 major party candidates on the primary ballot this year, including 870 Democrats, or 41.08%% of all candidates who ran, and 1,248 Republicans, or 58.92% of all candidates who ran.
- The 870 Democrats who appeared on the primary ballot this year were 75 fewer than the 945 who appeared on the ballot in 2020 and 211 fewer than the 1,081 who appeared in 2018.
- The 1,248 Republicans who appeared on the ballot were 195 more than the 1,053 who appeared on the ballot in 2020 and 382 more than the 866 who appeared in 2018.
- The percentage of major party candidates this year who identified as Democrats was lower than in 2020, when 47.3% of major party candidates did, and in 2018, when 55.52% did.
- Conversely, the percentage of major party candidates who identified as Republicans this year was higher than in 2020, when 52.7% did, and in 2018, when 44.48% did.
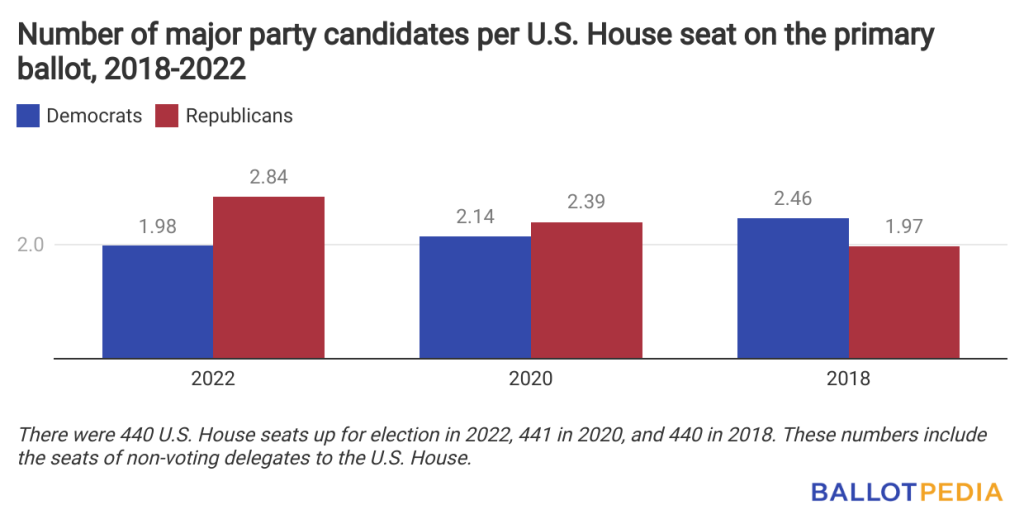
- There were 1.98 Democratic candidates on the ballot per U.S. House seat this year. That’s fewer than the 2.14 Democrats per seat who appeared on the ballot in 2020 and the 2.46 Democrats per seat who appeared in 2018.
- There were 2.84 Republican candidates on the ballot per U.S. House seat in 2022. That's more than the 2.39 Republicans per seat who appeared on the ballot in 2020 and the 1.06 Republicans per seat who appeared in 2018.