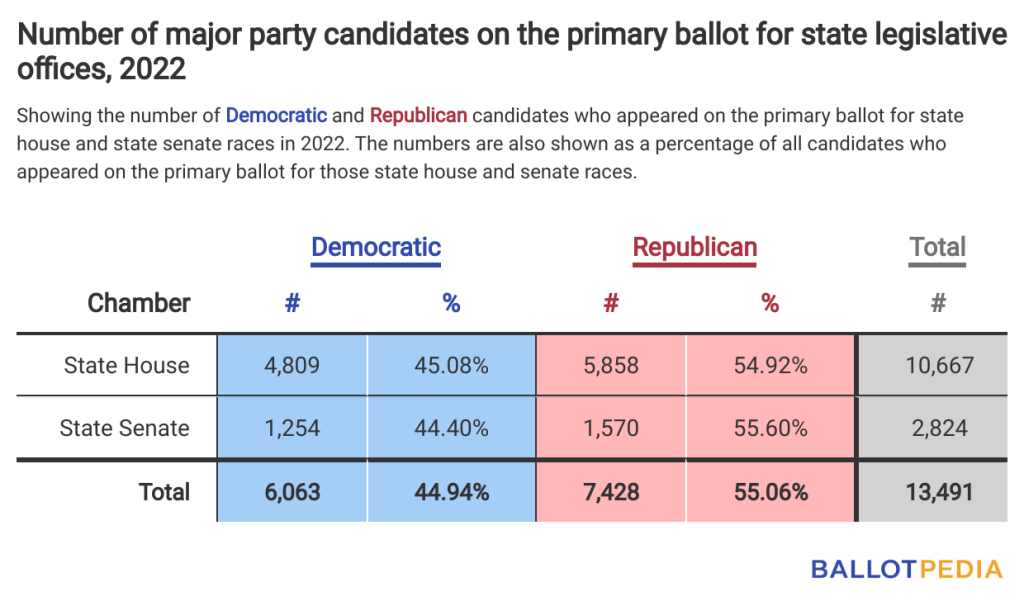
This year, 13,491 major party candidates were on the primary ballot for 6,278 state legislative seats around the country, including 1,300 state senate seats and 4,978 state house seats.
Of the 13,491 major party candidates on the ballot, 6,063, or 44.94%, were Democrats, and 7,428, or 55.06%, were Republicans.
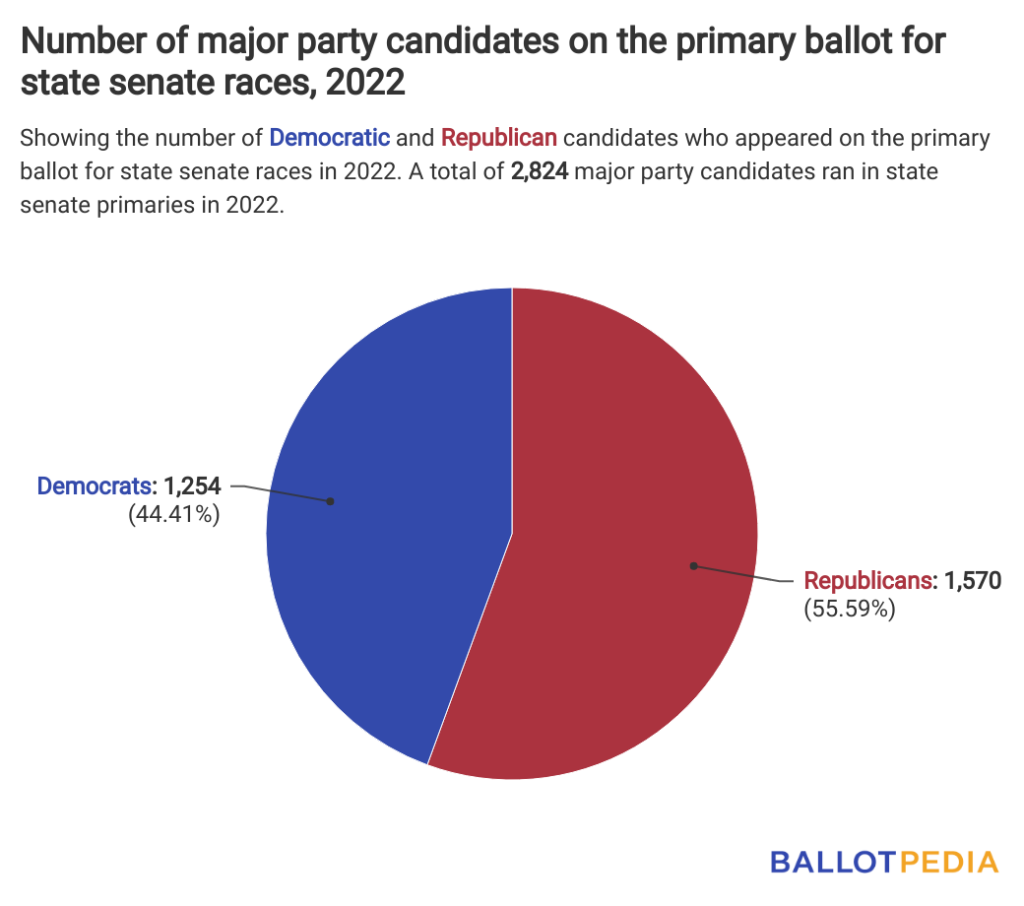
In state senate races:
- There were 2,824 major party candidates on the primary ballot, including 1,254 Democrats, or 44.41% of all candidates who ran, and 1,570 Republicans, or 55.59% of all candidates who ran.
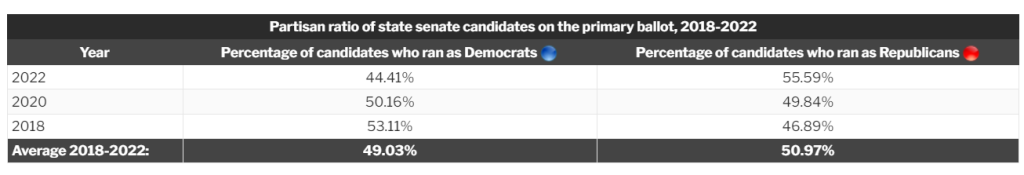
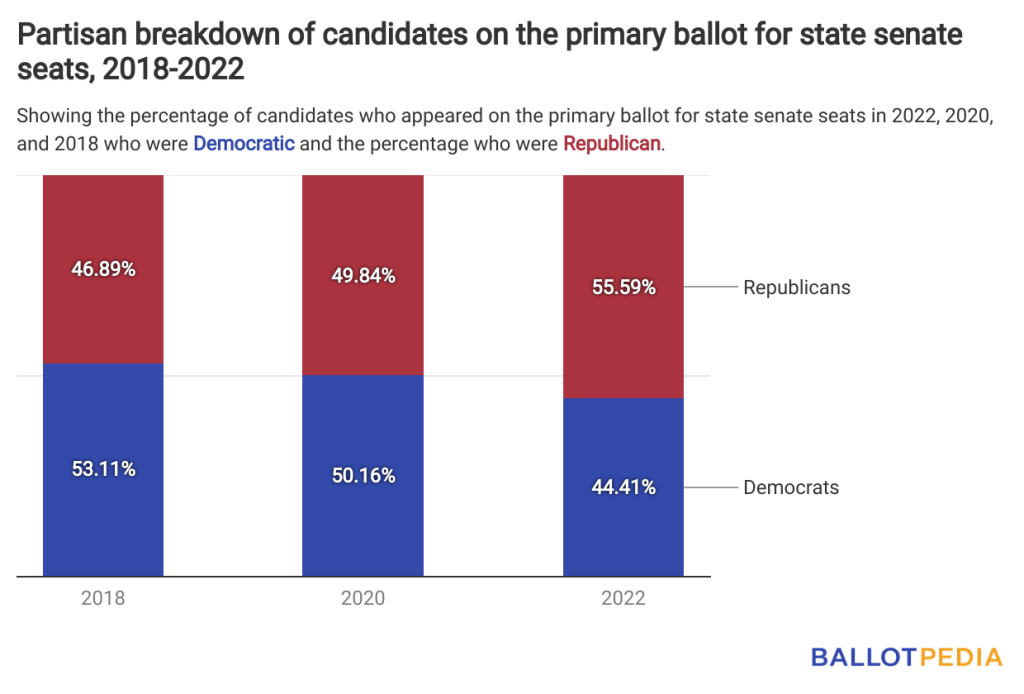
- The percentage of major party candidates this year who identified as Democrats was lower than in 2020, when 50.16% of major party candidates did, and in 2018, when 53.11% did.
- Conversely, the percentage of major party candidates who identified as Republicans this year was higher than in 2020, when 49.84% did, and in 2018, when 46.89% did.
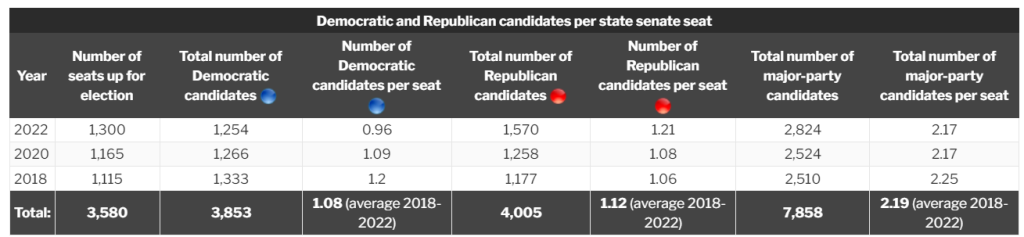
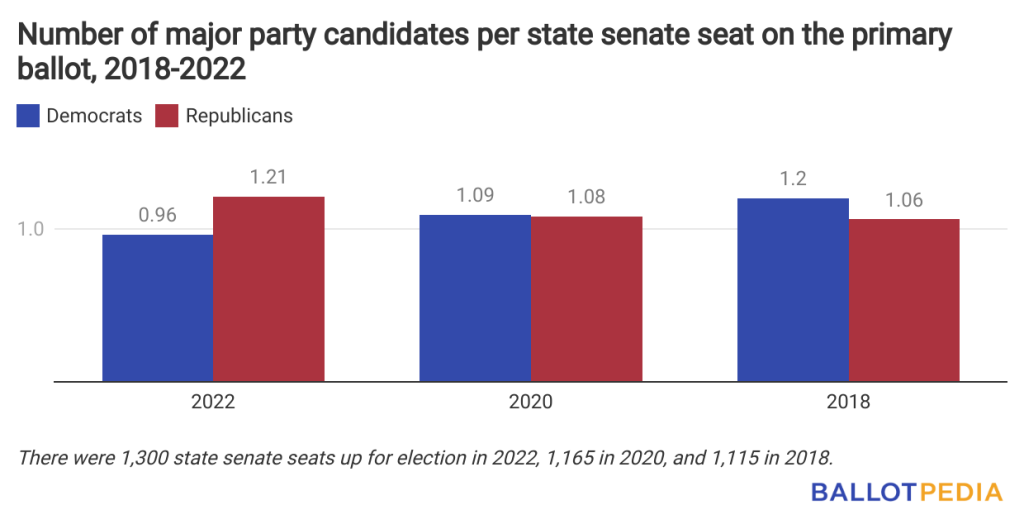
- There were 0.96 Democratic candidates on the ballot per state senate seat this year. That’s fewer than the 1.09 Democrats per seat who appeared on the ballot in 2020 and the 1.2 Democrats per seat who appeared in 2018.
- There were 1.21 Republican candidates on the ballot per U.S. state senate seat in 2022. That's more than the 1.08 Republicans per seat who appeared on the ballot in 2020 and the 1.06 Republicans per seat who appeared in 2018.
In state house races:
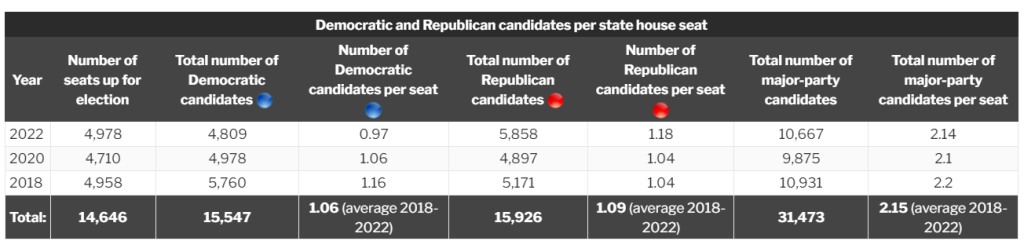
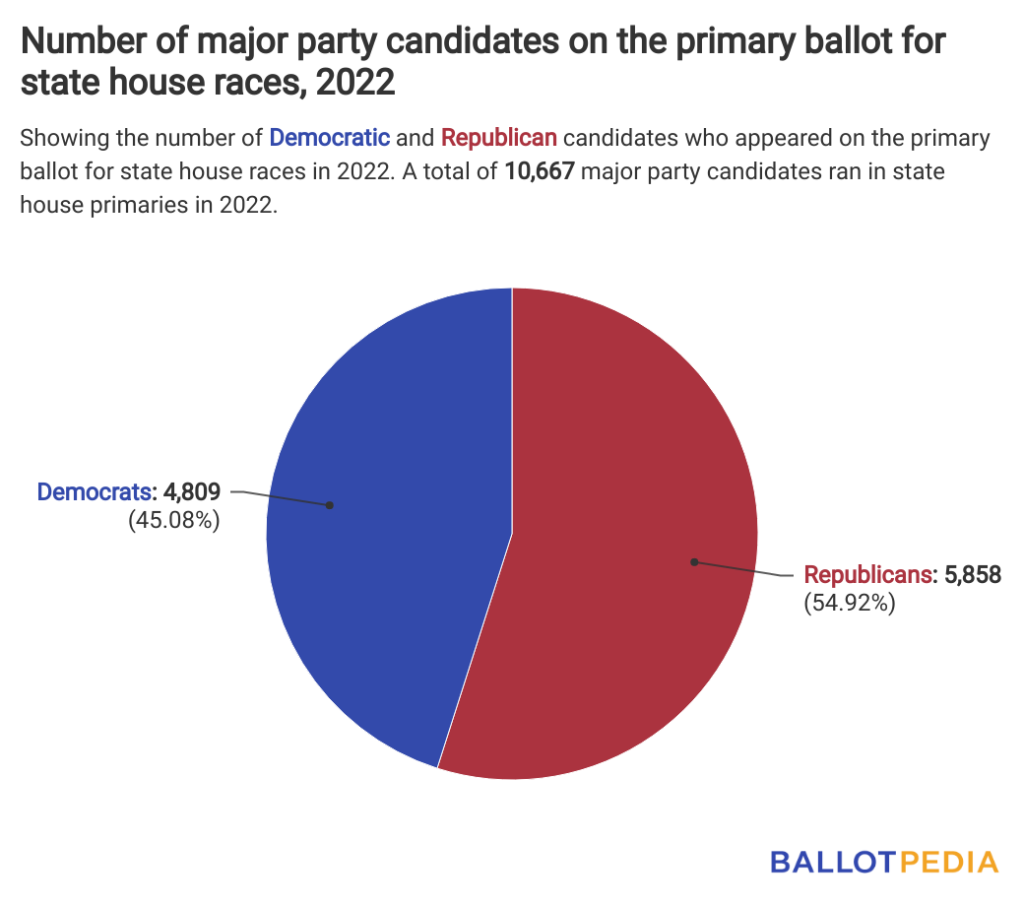
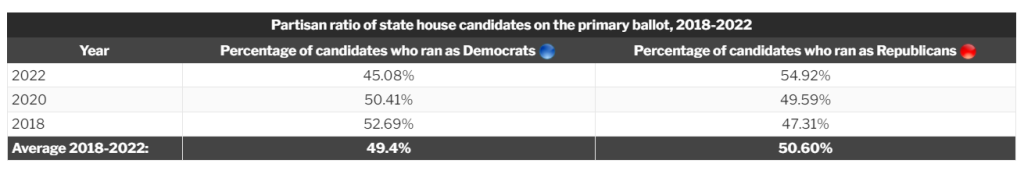
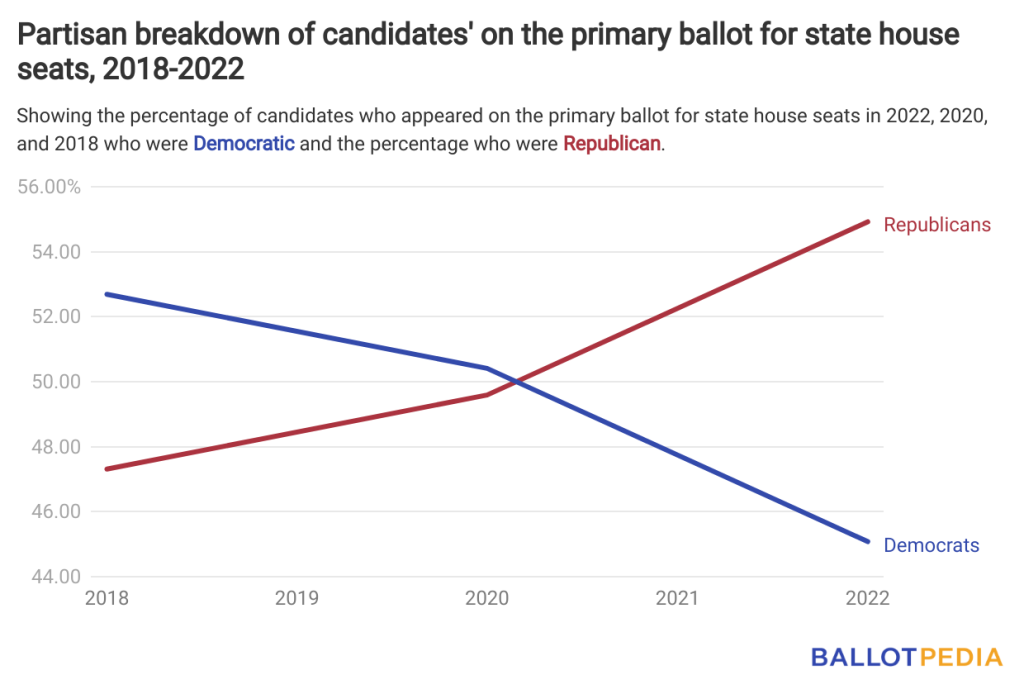
- There were 10,667 major party candidates on the primary ballot this year, including 4,809 Democrats, or 45.08% of all candidates who ran, and 5,858 Republicans, or 54.92% of all candidates who ran.
- The percentage of major party candidates this year who identified as Democrats was lower than in 2020, when 50.41% of major party candidates did, and in 2018, when 52.69% did.
- Conversely, the percentage of major party candidates who identified as Republicans this year was higher than in 2020, when 49.59% did, and in 2018, when 47.31% did.
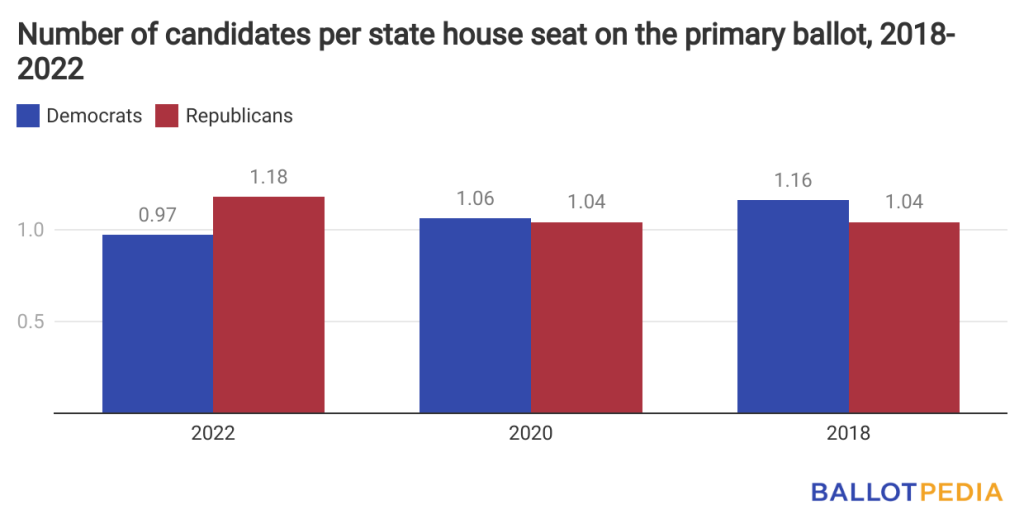
- There were 0.97 Democratic candidates on the ballot per state house seat this year. That’s fewer than the 1.06 Democrats per seat who appeared on the ballot in 2020 and the 1.16 Democrats per seat who appeared in 2018.
- There were 1.18 Republican candidates on the ballot per state house seat in 2022. That's more than the 1.04 Republicans per seat who appeared on the ballot in 2020 and in 2018.