


Thirty-three U.S. states and territories report the party affiliations of registered voters as indicated on their voter registration forms. In states with closed primaries, affiliation with a political party can be a condition of participation in that party's primaries. The remaining states either do not request partisan affiliations on their registration forms or they do not report the totals publicly.
The map below shows the 33 states and territories that display voter registration figures publicly. Note that the U.S. Virgin Islands does not appear on this map.
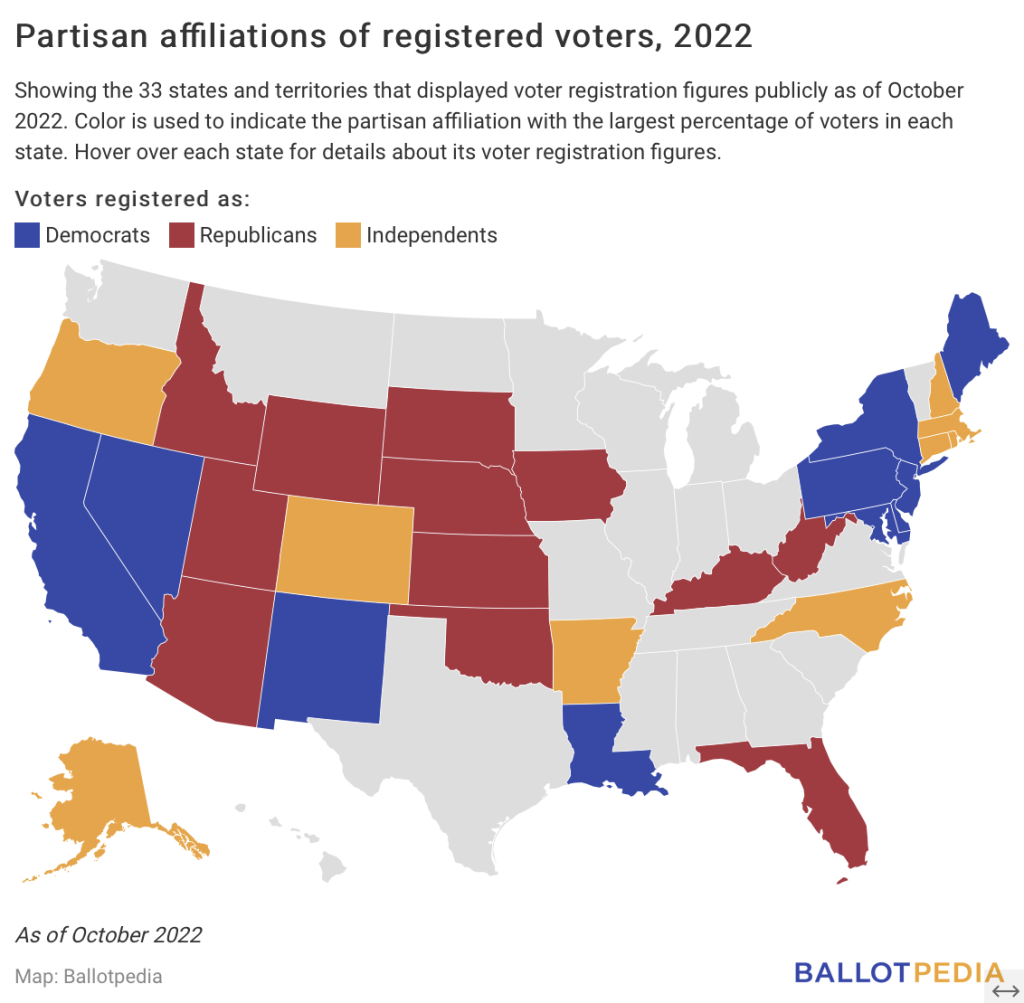
In 23 of the 33 included states and territories, no single partisan affiliation included the majority of registered voters. Democrats were the majority of registered voters in Maryland, Washington, D.C., and the U.S. Virgin Islands and were the largest plurality of registered voters in nine other states. Republicans were a majority of registered voters in Idaho, Oklahoma, Utah, and Wyoming and were the largest plurality of registered voters in eight other states.
The majority of registered voters were independents or unaffiliated with any political party in Alaska, Arkansas, and Massachusetts. Independents were the largest plurality in six other states. Members of other political partieswere neither a majority nor the largest plurality in any of the states or territories covered.
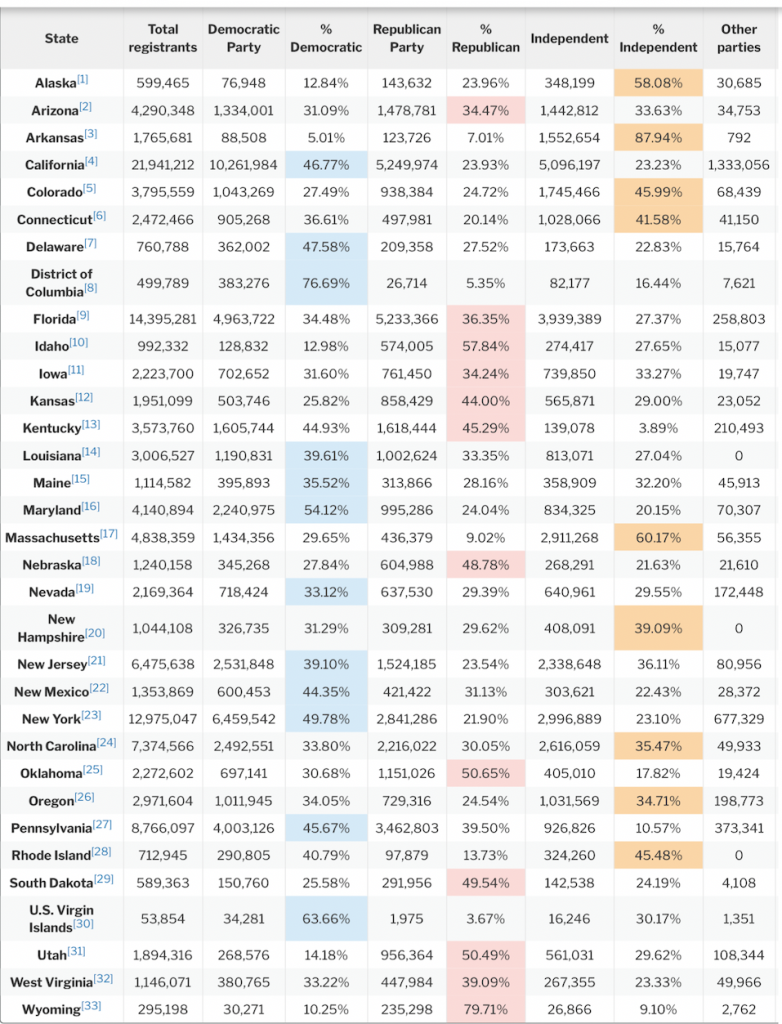
The table below provides a detailed breakdown of the partisan affiliations of registered voters in the states and territories that publicly report these figures.
In the 2020 presidential election, Joe Biden (D) received a combined 53.5% of the vote to Donald Trump’s (R) 44.7% across the 33 included states and territories. Nearly 124 million registered voters reside in these areas. According to Ballotpedia’s analysis, 48 million registered voters in these areas identified themselves as Democrats. At 38.78%, Democrats represented the single largest share of registered voters in the included states and territories. A total of 36.4 million registered voters identified themselves as Republicans, representing 29.42% of registered voters in the included areas. Approximately 4 million registered voters identified themselves as members of other political parties. This amounted to 3.25% of registered voters in these areas.
A total of 35.3 million registered voters identified themselves as independents or unaffiliated with any political party. This amounted to 28.55% of registered voters in the included areas. Independent and third-party voters were 31.80% of all registered voters in these areas. For context, independent and third-party presidential candidates received about 1.9% of the vote nationwide.