Tag2020 presidential coverage

Comparing 2020 presidential and senatorial vote share by party

Image of donkey and elephant to symbolize the Democratic and Republican parties.

Ballotpedia compared the performance of Joe Biden (D) and Donald Trump (R) in the 2020 presidential election to Democratic and Republican Senate candidates in each state.

Thirty-five U.S. Senate elections were held in the general election. Biden outperformed Chris Janicek (D) in Nebraska, Sara Gideon (D) in Maine, and the cumulative vote total for Democratic Senate candidates in Louisiana by the largest margins with a percentage difference of 27.0%, 22.5%, and 15.8%, respectively.

Biden underperformed Steve Bullock (D) in Montana, Doug Jones (D) in Alabama, and Mike Espy (D) in Mississippi by the largest margins with a percentage difference of 10.7%, 8.0%, and 7.0%, respectively.

The following map shows the percentage difference between Biden and Democratic Senate candidates in all states that held Senate elections. Positive numbers indicate Biden overperformed. Negative numbers indicate Biden underperformed. 

Trump outperformed Allen Water (R) in Rhode Island, Bryant Messer (R) in New Hampshire, and Lauren Witzke (R) in Delaware, by the largest margins with a percentage difference of 19.2%, 11.4%, and 7.5%, respectively.

Trump underperformed Susan Collins (R) in Maine, Mike Rounds (R) in South Dakota, and Ben Sasse (R) in Nebraska, by the largest margins with a percentage difference of 14.6%, 5.7%, and 4.7%, respectively.

The following map shows the percentage difference between Trump and Republican Senate candidates in all states that held Senate elections. Positive numbers indicate Trump overperformed. Negative numbers indicate Trump underperformed.

Additional reading:


Absentee/mail-in ballot rejection rates decreased in at least 20 states between the 2016 and 2020 presidential elections

Ballotpedia’s analysis of 2020 election data shows that at least twenty states rejected a lower percentage of absentee/mail-in ballots during the 2020 presidential election than they did in 2016. At least seven states rejected a greater percentage and four states’ rejected the same percentage. Nineteen states have not yet released data making a comparison possible and were not included in this analysis.

The number of absentee/mail-in ballots cast in the 31 states shown above increased 109% from 24.4 million in 2016 to 50.9 million in 2020. The number of rejected ballots also increased from 222,096 in 2016 to 364,242 in 2020, a 64% increase. 

While the number of absentee/mail-in ballots cast and rejected were both higher in 2020 than in 2016, the rejection rate across these 31 states decreased by 0.2 percentage points from 0.9% in 2016 to 0.7% in 2020.

Nationwide, voters cast just under 33.4 million absentee mail/in ballots in 2016 with a rejection rate of 1.0%. In 2020, voters cast an estimated 65.6 million.

The table below shows the 2020 rejection rates Ballotpedia has gathered so far. Vermont is included with its 2020 rejection rate but excluded from other analyses due to the lack of 2016 data.

Data from 2016 was gathered from the U.S. Election Assistance Commission’s (EAC) 2016 Election Administration Voting Survey, a biannual state-by-state analysis of elections’ administration mandated by the 2002 Help America Vote Act. Ballotpedia gathered information on 2020 rejection rates using news sources, publicly available election statistics, and direct outreach to state election officials.

To view more analyses of rejected absentee/mail-in ballots and to learn more about how Ballotpedia gathered this preliminary data, click here: https://ballotpedia.org/Election_results,_2020:_Analysis_of_rejected_ballots


Michigan Court of Claims invalidates absentee/mail-in ballot rule as improperly established

On March 9, 2021, Michigan Court of Claims Judge Christopher Murray invalidated an absentee/mail-in ballot rule instituted by Secretary of State Jocelyn Benson (D) in the run-up to the November 3, 2020, general election. Murray held that Benson’s rule, which directed local clerks to presume validity when verifying signatures on absentee/mail-in ballot applications and return envelopes, had been issued in violation of the Administrative Procedures Act (APA).

Benson’s guidance, issued on October 6, 2020, directed local clerks to treat signatures as valid if there are “any redeeming qualities in the application or return envelope signature as compared to the signature on file.” “Redeeming qualities” are described as including, but not being limited to, “similar distinctive flourishes” and “more matching features than non-matching features.” Allegan County Clerk Robert Genetski and the Republican Party of Michigan filed suit against Benson, alleging that her guidance violated the state’s election laws and the Administrative Procedures Act. The plaintiffs asked that the court strike down the guidance as unlawful and enjoin its enforcement in future elections.

Murray sided with the plaintiffs, finding that Benson’s guidance was in fact a rule “that should have been promulgated in accordance with the APA. And absent compliance with the APA, the ‘rule’ is invalid.” Under the Administrative Procedures Act, a state agency is required to follow formal rulemaking procedures (e.g., when establishing policies that “do not merely interpret or explain the statute of rules from which the agency derives its authority,” but rather “establish the substantive standards implementing the program.”)

It is unclear whether the state will appeal Murray’s decision.

Background: Last year, 39 states, including Michigan, modified their administrative and/or statutory election procedures ahead of the general election. These modifications (and, in some cases, the lack thereof) triggered a wave of litigation activity. In the run-up to the general election, there were at least 425 lawsuits, and subsequent appeals, filed, 242 of which dealt primarily with absentee/mail-in voting procedures. Although courts issued orders in most of these cases before November 3, 2020, they did not necessarily make final rulings on the questions of law presented in those cases. Murray’s ruling is an example of a post-2020 court action addressing the ultimate legality of policies implemented in 2020. Although a ruling like this one will not have an effect on the 2020 election, it will bear on the conduct of future elections.

Other recent examples of noteworthy post-2020 court actions include the following:

• Virginia: On January 13, 2021, Judge William Eldridge signed a consent decree between the parties in Reed v. Virginia Department of Elections. One of the conditions of the agreement was that the Virginia Department of Elections rescind an administrative rule, which was in place during the 2020 election cycle, that allowed for absentee/mail-in ballots returned with illegible postmarks to be counted, provided that the ballots were signed on or before Election Day.

• Arizona: Earlier this month, Maricopa County Superior Court Judge John Hannah ordered the Republican Party of Arizona to pay the Office of the Arizona Secretary of State $18,238 in legal fees, finding that the party had acted “in bad faith” in filing a lawsuit last year to postpone certification of the state’s election results. An attorney for the Arizona GOP said the party would appeal Hannah’s order.

Additional Reading:


Average margin of victory in Pivot Counties has shifted by 25.1 percentage points from Democrats to Republicans since 2008

Ballotpedia is concluding its analysis of Pivot Counties in the 2020 presidential election with a look at the presidential margins of victory in these counties and how they have changed over time.

Pivot Counties are the 206 counties nationwide that voted for Barack Obama (D) in 2008 and 2012 and Donald Trump (R) in 2016.

In 2020, we have used the following categories to describe these counties:

  • Retained Pivot Counties, which voted for Trump again this year, and 
  • Boomerang Pivot Counties, which voted for Joe Biden (D) on Nov. 3.

Following the 2020 presidential election, there were 181 Retained Pivot Counties and 25 Boomerang Pivot Counties.

In 2008, Obama had an average margin of victory of 12.3 percentage points across all 206 of these counties. In 2020, the average result across all Pivot Counties was a win for Trump by a margin of 12.8 percentage points. This represents a shift of 25.1 percentage points towards Republicans.

When looking at just the 181 Retained Pivot Counties, the margin shift from 2008 increases to 26.2 percentage points. Of those 181 counties, Trump won a larger margin of victory in 113 compared to his 2016 results. Trump’s margin decreased in 68 Retained Pivot Counties.

The average margins in the 25 Boomerang Pivot Counties Joe Biden (D) won in 2020 shifted 10.2 percentage points towards Republicans when compared to results from the same counties in 2008.

The chart below shows the overall change in average margins of victory by Pivot County category between 2008 and 2020. 

The table below shows the margins of victory from each presidential election since 2008 using the categories above. The rightmost section shows the total change since 2008 both in percentage points and percent change. In Retained Pivot Counties, the average margin of victory has shifted 217% towards Republicans. In the 25 Boomerang Pivot Counties that voted for Biden, the average margin has shifted 76% towards Republicans.

The Pivot Counties where Trump’s margin of victory increased from 2016 were located primarily in the Southeast and Upper Midwest, concentrated in states like Iowa, Illinois, Wisconsin, and Minnesota. Counties where Trump’s margin decreased in 2020 were located primarily in New England and the Northeast.

Woodruff County, Ark., a Retained Pivot County, had the largest margin change towards Trump in 2020 with an 18.8 percentage point shift. Ziebach County, S.D., a Boomerang Pivot County, had the largest margin change towards Biden with a 10.5 percentage point shift.

The map below does not differentiate between Retained and Boomerang Pivot Counties. Instead, it shows counties based on whether their margins of victory became either more Republican, towards Trump, or more Democratic, towards Biden, compared to 2016 results.

To learn more about 2020 presidential election margins of victory in Retained and Boomerang Pivot Counties, click here: Election results, 2020: Pivot Counties’ margins of victory analysis


Biden to be inaugurated as 46th president

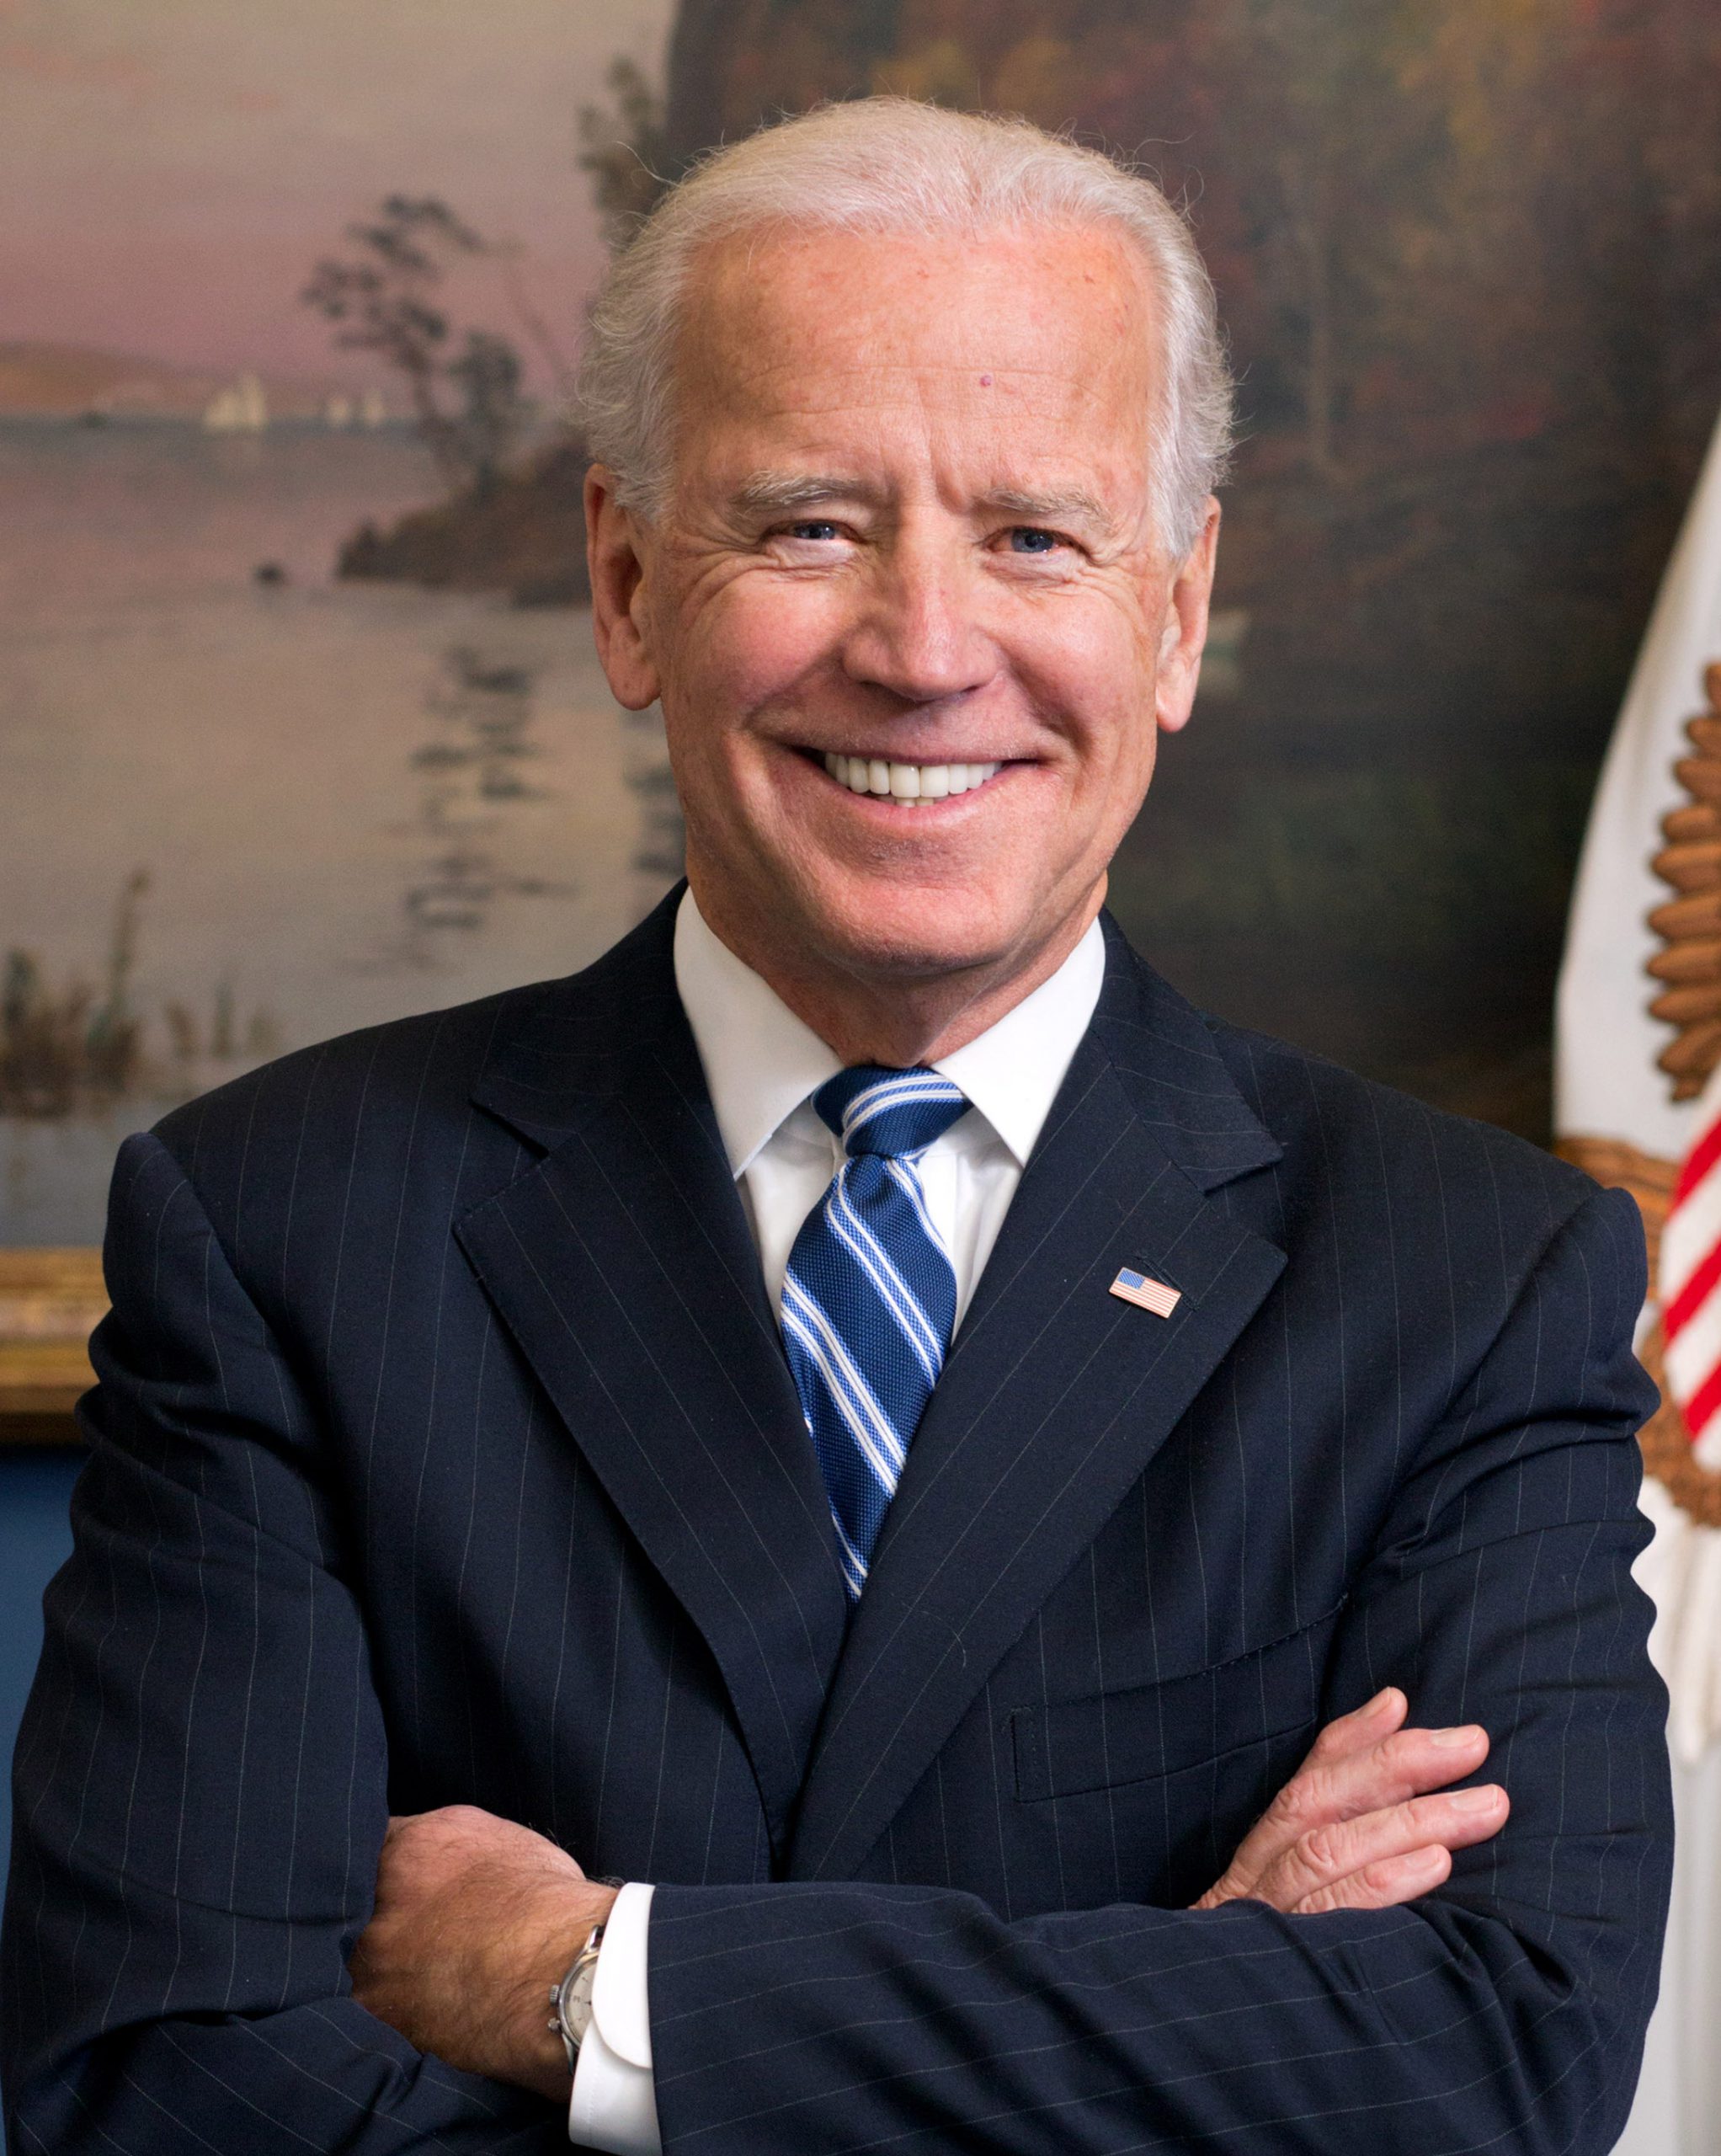
Former Vice President Joe Biden (D) will be sworn in as the 46th president of the United States on Jan. 20. Sen. Kamala Harris (D-Calif.) will also be sworn in as the 49th vice president of the United States, becoming the first Black woman and person of South Asian descent to serve in the office.

Due to security concerns stemming from the breach of the U.S. Capitol, up to 25,000 National Guard members are expected to be in Washington, D.C. The National Mall will be closed to the general public, and there will be no public parade from the Capitol to the White House.

The ceremony will be streamed on https://bideninaugural.org/watch/ and broadcast across all major television networks and platforms.

President Donald Trump (R) will not participate in the event. The last incumbent president to skip his successor’s inauguration for political reasons was Andrew Johnson in 1869.


What happens when the Electoral College votes on Dec. 14?

The Electoral College is the process by which the states and District of Columbia elect the president of the United States. Each state is represented by a number of electors equal to the size of its congressional delegation. There are 538 electors in total. To win the Electoral College, a candidate must receive a majority—at least 270—electoral votes.

In each state, a presidential candidate has a slate of electors that is typically selected by the state party through conventions or a committee vote. When a candidate wins the statewide popular vote in a state, his or her slate of electors is chosen to represent that state in the Electoral College.

The only exceptions are Maine and Nebraska, which assign two at-large electors to the statewide winner and one elector to the winner from each congressional district.

This year, electors from each state will separately meet on Dec. 14 to cast their votes for president and vice president. Although there is no constitutional provision or federal law requiring electors to vote in accordance with the election results in their state, electors typically vote for their pledged candidates.

The electors from each state then sign and seal six certificates of the vote. By Dec. 23, these documents must be delivered to the president of the Senate, state secretary of state (two copies), to the archivist of the United States (two copies), and the judge of the U.S. district court in the district where they met.

Congress will count the electoral votes in a joint session and declare a winner—subject to any objections to an individual state’s electoral votes—on Jan. 6.

Fourteen states have provisions permitting the disqualification and replacement of faithless electors whose vote deviates from the state’s popular vote. 

In 2016, votes for president and vice president were cast by seven faithless electors: five Democratic and two Republican.

Additional reading:


President Donald Trump leads in endorsement win rates among Ballotpedia’s tracked influencers

During the 2020 election cycle, Ballotpedia tracked candidate endorsements from five noteworthy influencers: President Donald Trump (R), President-elect Joe Biden (D), former President Barack Obama (D), Vice President Mike Pence (R), and Senator Bernie Sanders (I). 

Obama issued the most endorsements in 2020 elections at 232, according to Ballotpedia’s count. Of these 232 endorsed candidates, 82 won, 115 lost, and 35 races were uncalled as of December 2nd. Not including uncalled races, 42% of Obama-endorsed candidates won their races.

We counted 181 endorsements that Trump issued during the 2020 elections, the third-highest among our tracked influencers. Of these candidates, 136 won, 40 lost, and five races were uncalled as of December 2nd. Not including uncalled races, 77% of Trump-endorsed candidates won their races.

Biden issued 50 endorsements in 2020. Twelve of these candidates won, 29 were defeated, and nine races were uncalled as of December 2nd. Not including uncalled races, 29% of Biden-endorsed candidates were elected to office.

We counted 202 endorsements that Sanders issued during the 2020 elections, the second-highest among our tracked influencers. Of these candidates, 125 won, 62 lost, and 15 races were uncalled as of December 2nd. Not including uncalled races, 67% of Sanders endorsed candidates won their elections.

At 10 endorsements issued in 2020 by Ballotpedia’s count, Pence endorsed the fewest candidates in 2020 among our tracked influencers. Seven of these candidates won and three were defeated, meaning Pence-endorsed candidates won 70% of the time.

Additional reading:


A closer look at historical margins of victory in Boomerang and Retained Pivot Counties

Following the 2016 presidential election, there were 206 Pivot Counties that voted for Barack Obama (D) in 2008 and 2012 before voting for Donald Trump (R) in 2016.

Based on unofficial 2020 results, there were 22 Boomerang Pivot Counties, which flipped to Joe Biden (D), and 174 Retained Pivot Counties, which voted for Trump again.

In 2016, Trump’s average margin of victory in what are now the 22 Boomerang Pivot Counties counties was 1.97 percentage points, 9.45 points fewer than his average across all Pivot Counties. By contrast, Obama overperformed in these counties, relative to his overall averages, in 2012 and 2008.

On the other hand, compared to 2016, Trump’s average margin of victory in the 174 Retained Pivot Counties increased by 2.15 percentage points. Trump had overperformed in the Retained Pivot Counties in 2016, exceeding his overall average margin of victory by 1.06 percentage points. Obama underperformed in these counties in 2008 and 2012.

To learn more about Boomerang Pivot Counties, click here: https://ballotpedia.org/Election_results,_2020:_Boomerang_Pivot_Counties

To learn more about Retained Pivot Counties, click here: https://ballotpedia.org/Election_results,_2020:_Retained_Pivot_Counties


Three states split presidential and gubernatorial vote

Three states voted for presidential and gubernatorial candidates of different parties this year, while at least two voted for presidential candidates of a different party than the state’s trifecta status.

A state government trifecta occurs when one party holds a state’s governorship and majorities in both chambers of the state legislature. Heading into the 2020 elections, Republicans held 21 state government trifectas and Democrats held 15. The 14 remaining states had divided government, where neither party holds a trifecta. Republicans gained at least two trifectas in states with divided governments this year, picking up trifectas in Montana and New Hampshire. As of Nov. 16, Alaska’s final trifecta status remained too close to call, leaving the possibility of a third trifecta pickup for Republicans. No other states’ trifecta statuses changed as a result of the election.

Joe Biden (D) won all 15 states with Democratic trifectas as well as Arizona, which has a Republican trifecta, and New Hampshire, which gained one. As of Nov. 16, the results of the presidential election in Georgia, a Republican trifecta, remained too close to call. Four of the five outlets Ballotpedia tracks had called the state for Joe Biden.

Donald Trump (R) won the other 20 Republican trifecta states. Of the 12 states with divided government after the election (including Alaska), five voted for Donald Trump and seven for Joe Biden.

Eleven states elected a governor this year, including seven with Republican governors at the time of the election and four with Democratic governors. Three states split their presidential and gubernatorial votes. New Hampshire and Vermont re-elected the Republican governors first elected in 2016 while voting for Joe Biden for president. North Carolina re-elected the Democratic governor first elected in 2016, while voting a second time for Donald Trump.

All 11 states also held gubernatorial elections in 2016. That year, five states split their presidential and gubernatorial votes. Montana, North Carolina, and West Virginia elected Democratic governors while also voting for Donald Trump (R). New Hampshire and Vermont elected Republican governors while also voting for Hillary Clinton (D).

Both Montana and West Virginia voted for Donald Trump a second time while also electing a Republican as governor. In Montana, Greg Gianforte (R) was elected governor after losing to incumbent Steve Bullock (D) in the 2016 election. In West Virginia, Jim Justice (R) was re-elected. Justice was first elected as a Democrat in 2016 and joined the Republican Party the following year.


Joe Biden projected to win 2020 presidential election

Former Vice President Joe Biden (D) is the projected winner of the 2020 presidential election, according to a consensus call from ABC News, CNN, Fox News, NBC News, and The New York Times. Projected to win Pennsylvania, Biden has won at least 273 electoral votes, putting him over the threshold of 270 electoral votes needed to win the presidency. President Donald Trump (R) won at least 213 electoral votes.

Biden will be the oldest president to take office on January 20, 2021, at 78 years old. His running mate, Sen. Kamala Harris (D-Calif.), will be the first Black woman and person of South Asian descent to serve as vice president.

George H.W. Bush (R) was the last president to lose his re-election campaign in 1992.

Races remain too close to call in four battleground states: Arizona, Georgia, Nevada, and North Carolina. Biden currently leads in the first three states, totaling 33 electoral votes. Trump leads in North Carolina, which has 15 electoral votes.